Assessing Disney’s Business Segment Performance in Fiscal 2015
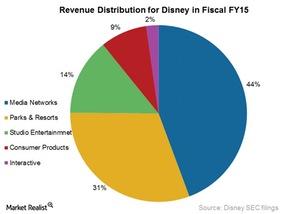
Disney’s (DIS) Media Networks segment was the biggest contributor to its revenue, at 44% or $52.5 billion, in fiscal 2015.
Nov. 6 2015, Published 3:40 p.m. ET

Media Networks
As the chart below shows, Disney’s (DIS) Media Networks segment was the biggest contributor to its revenue, at 44% or $52.5 billion, in fiscal 2015. The rise in revenues was driven by an increase in affiliate fees, higher advertising revenues at ESPN, and the ABC television network.
This segment recorded revenues of $23.3 billion in fiscal 2015, up 10% over fiscal 2014. Its operating income was $7.8 billion in fiscal 2015, up 6% over fiscal 2014.
Parks & Resorts
This segment contributed 31% to Disney’s revenues in fiscal 2015 with revenues of $16.2 billion. Its operating income was $3 billion in fiscal 2015, a rise of 14% year-over-year. The increase in operating income was mainly driven by higher attendance and occupancy and an increase in average guest spending at Disney’s parks and resorts in the United States.
Studio Entertainment
This segment recorded revenues of $7.4 billion in fiscal 2015, a rise of 1% over fiscal 2014, contributing 14% to Disney’s total revenues in fiscal 2015. Its operating income was $1.9 billion in fiscal 2015, up 27% over fiscal 2014. The rise in operating income was because of an increase in revenue share from Frozen merchandise. This segment shares revenues from merchandise with Disney’s Consumer Products segment.
Consumer Products
This segment recorded revenues of $4.5 billion in fiscal 2015, up 13% over fiscal 2014. Operating income was $1.8 billion in fiscal 2015, up 29% over fiscal 2014. The growth in operating income was mainly driven by a rise in merchandise licensing revenue from Frozen, Avengers, and Star Wars merchandise.
Interactive
This segment recorded revenues of $1.2 billion in fiscal 2015, a decline of 10% from fiscal 2014. Its operating income was $132 million in fiscal 2015, up 14% over fiscal 2014. The growth in operating income was mostly driven by the Tsum Tsum mobile game.
Disney makes up 3.5% of the PowerShares Dynamic Large Cap Growth Fund (PWB). This ETF also invests 3.8% of its portfolio in Facebook (FB), 3.7% in Alphabet (GOOG), and 1.8% of Activision Blizzard (ATVI).
