Analyzing Whole Foods’ Store Performance and Profitability
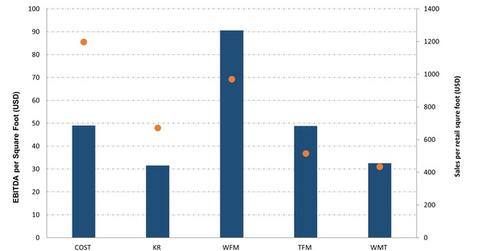
Whole Foods has only trailed Costco in per-foot sales metrics. Costco averaged more than $1100 between fiscal 2011 and fiscal 2015.
Nov. 23 2015, Updated 10:06 a.m. ET

Whole Foods’ store expansion
Whole Foods Market (WFM) operates 433 stores, 414 of which, or 96%, are based in the United States, ten in Canada, and nine in the United Kingdom, as of September 2015. Whole Foods has a target of opening approximately 30 new stores in fiscal 2016 and expects to hit the 500-store mark by 2017. Over the long term, the company sees a potential for 1,200 Whole Foods stores in the US alone. With its new 365 format expected to be launched in 2016, the management sees growth opportunity beyond 1,200 stores.
Sales per square foot trend
Whole Foods’ store performance has long been one of the envies of the grocery industry. The company gave one of the best sales per square foot during the past five fiscal years (fiscal 2011–fiscal 2015). During that five-year period, sales per square foot for the company averaged ~$950, compared to Kroger Company’s (KR) $623, The Fresh Market’s (TFM) $497, and Supervalu’s (SVU) $573.
Whole Foods has only trailed Costco Wholesale Corporation (COST) in per-foot sales metrics—Costco averaged more than $1100 between fiscal 2011 and fiscal 2015—but we should note that Costco operates more as a wholesaler, focusing on bulk sales. Whole Foods is looking at a per-square-foot growth of 7% or greater in fiscal 2016.
We should note here that the above comparison is for Whole Foods’ latest fiscal year, fiscal 2015, which ended on September 27, 2015. The year-end dates for fiscal 2015 for the above retailers are as follows:
- Costco—August 30, 2015
- Kroger—January 31, 2015
- Whole Foods—September 27, 2015
- The Fresh Market—January 25, 2015
- Wal-Mart Stores—January 31, 2015
EBITDA per square footage
Whole Foods boasts best-in-class in EBITDA per square foot, which stood at $91 in fiscal 2015, compared to The Fresh Market’s $49 and Kroger’s $31.
ETF exposures and what’s next
Whole Foods (WFM) has exposure in the VanEck Vectors Retail ETF (RTH) (around 1.6% weightage) along with Wal-Mart (WMT), Costco (COST), and Kroger (KR), which have weights of 6.4%, 5.5%, and 4.7%, respectively.
Continue to the next part of this series for a look at Whole Foods’ sales growth in comparison with its margins.
