Microsoft Trades below Moving Averages in August
Out of 41 analysts covering Microsoft (MSFT), 22 have a “buy” recommendation on it, six have a “sell” recommendation, and 13 recommend “hold.”
Oct. 9 2015, Updated 7:04 p.m. ET

Shareholder returns and stock trends
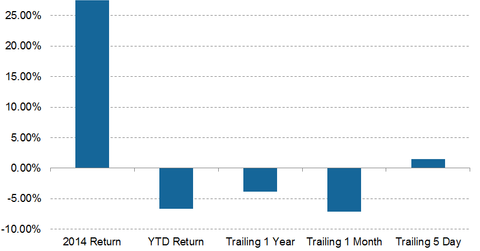
Microsoft (MSFT) generated investor returns of -3.84% in the trailing 12-month period and -7.15% in the trailing one-month period. In comparison, it generated 27.54% in 2014 and -6.65% YTD (year-to-date). The firm’s share price increased 1.52% in the trailing five-day period.
In comparison, VMware (VMW) and NetSuite (N)—peer companies in the system software subsector—declined -10.02% and -11.54%, respectively, in the trailing one-month period.
Moving averages
On September 1, 2015, Microsoft (MSFT) closed the trading day at $43.36. Based on this figure, here’s how the stock fared in terms of its moving averages:
- 78% below its 100-day moving average of $45.86
- 53% below its 50-day moving average of $45.43
- 95% below its 20-day moving average of $45.15
Moving average convergence divergence and the relative strength index
The MACD (moving average convergence divergence) is the difference between the short-term and long-term moving averages of a firm. Microsoft’s 14-day MACD is -0.65. This negative figure indicates a downward trading trend.
The company’s 14-day RSI (relative strength index) is 36, which shows that the stock is slightly oversold. Generally, if the RSI is above 70, it indicates the stock is overbought. An RSI figure of below 30 suggests that a stock has been oversold.
Analyst recommendations
Out of 41 analysts covering Microsoft (MSFT), 22 have a “buy” recommendation on it, six have a “sell” recommendation, and 13 recommend “hold.” The analyst stock price target for the firm is $50.46 with a median target estimate of $52.50. Given these figures, MSFT is trading at a discount of 17% with respect to the median analyst price target.
To gain exposure to Microsoft (MSFT), you can invest in the First Trust ISE Cloud Computing Index ETF (SKYY) ETF and the iShares North American Tech-Software ETF (IGV). The stock accounts for 2.31% and 9.15% of the portfolios, respectively.
