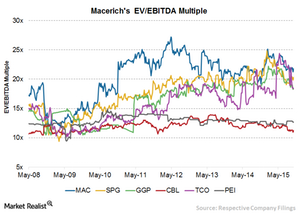
Macerich’s Highest EV-to-EBITDA Multiple Compared to Peers
Over the past eight years, Macerich’s EV-to-EBITDA has ranged between 11.9x–27.2x, with a current EV-to-EBITDA multiple of around 21.8x.
Oct. 26 2015, Updated 9:04 a.m. ET

EV-to-EBITDA ratio
EV (enterprise value)-to-EBITDA (earnings before interest, taxes, depreciation, and amortization) multiples are widely used in the valuation of real estate companies. EV represents the market value of a company’s equity and debt, minus cash and cash equivalents. Thus, the EV-to-EBITDA ratio values the worth of the entire company and not just the equity portion.
Why EV-to-EBITDA is preferred
A company that raises its debt to fund operations will have a lower PE (price-to-equity) ratio than a company that raises similar amounts of equity, even if the two companies have equivalent enterprise values. The company with the lower PE ratio will look cheaper than the company with the higher PE ratio.
The same applies to the PE multiple—a company with a substantial amount of debt may look cheaper than a company with less debt and a higher equity portion. But the REIT world is a capital-intensive business. Most REITs raise a lot of debt to fund their operations. Thus, the EV-to-EBITDA multiple becomes an additional tool in valuing REITs alongside the price-to-FFO (funds from operations) multiple.
Peer group EV-to-EBITDA multiples
A closer look at Macerich’s (MAC) EV-to-EBITDA multiple shows that it’s in line with its historical valuation. Over the past eight years, Macerich’s EV-to-EBITDA has ranged between 11.9x–27.2x, with a current EV-to-EBITDA multiple of around 21.8x. Macerich recorded its highest multiple in April 2012 and its lowest multiple in 2008. The current industry average EV-to-EBITDA multiple is 22.5x.
The higher valuation of Macerich can be attributed to its robust portfolio quality and more favorable growth outlook. In recent times, Macerich has acquired premium properties while disposing of the older ones. The portfolio restructuring that targets premium markets bodes well for Macerich, because this is likely to improve the company’s rental income.
Peer group comparison
Peer group comparisons show that Macerich’s EV-to-EBITDA multiple is higher than its close competitors. For example, Simon Property Group (SPG) trades at an EV-to-EBITDA multiple of 20.4x, while General Growth Properties (GGP) trades at 18.4x, and Taubman Centers (TCO) trades at 18.4x. Macerich (MAC) makes up 1.84% of the total holdings of the SPDR DJ Wilshire REIT ETF (RWR).
In the next and final part of this series, we’ll discuss investments in Macerich through ETFs.
