HACK Sees $1.3 Billion in Fund Inflows Since Inception
The HACK ETF generated investor returns of 3.7% since inception, and -1.4% in the trailing-one-month period. In comparison, it generated returns of -0.57% YTD.
Oct. 26 2015, Updated 12:56 p.m. ET

Overview of the HACK ETF
The PureFunds ISE Cyber Security ETF (HACK) tracks a market-cap-weighted portfolio of US cybersecurity companies. This ETF tracks the performance of 35 publicly-listed companies in the cyber security sector. The market capitalization of the HACK ETF is $1.1 billion with an expense ratio of 0.75%. Its average daily volume of shares traded is $15.7 million. The price-to-earnings ratio is 215.25x, whereas its price-to-book value ratio stands at 4.38x.
Top holdings
The top holdings of the ETF include Imperva at 4.2%, Fortinet (FTNT) at 3.7%, ProofPoint (PFPT) at 3.9%, CyberArk Software (CYBR) at 4.1%, Check Point Software at 3.9%, and Juniper Networks (JNPR) at 4.0%. These six holdings comprise over 22% of the total portfolio.
Fund flows in the ETF
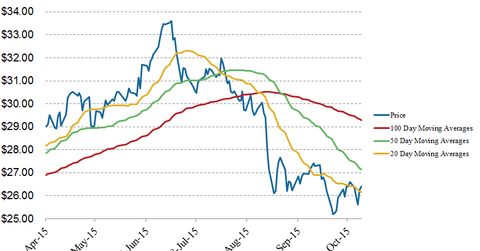
In the trailing one-month period, fund outflows for The PureFunds ISE Cyber Security ETF (HACK) were -$21.9 million. Comparatively, net fund inflows stood at $1.3 billion since the ETF’s inception in November 2014. Fund flows in the trailing-five-day and trailing-three-month (or quarterly) periods for the HACK ETF were -$11.7 million and -$56.4 million, respectively. Since August 3, 2015, the HACK ETF was trading consistently below its moving averages, and since then fund outflows in the ETF were -$116.3 million.
The HACK ETF generated investor returns of 3.7% since inception, and -1.4% in the trailing-one-month period. In comparison, it generated returns of -0.57% YTD (year-to-date) and -15.7% in the last three months. We can see that fund flows are directly related to ETF returns.
Moving averages
On October 23, 2015, the HACK ETF closed the trading day at $26.1. Based on this figure, here’s how the stock fares in terms of its moving averages:
- 10.1% below its 100-day moving average of $29.1
- 2.4% below its 50-day moving average of $26.8
- 0.45% above its 20-day moving average of $26
Relative strength index
The HACK ETF’s 14-day RSI (relative strength index) is 47.1, showing that the ETF could be slightly oversold[1. Generally, if the RSI is above 70, it indicates the stock is overbought. An RSI figure below 30 suggests that a stock has been oversold.].
