Evaluating Hershey’s Financials Against Its Competitors
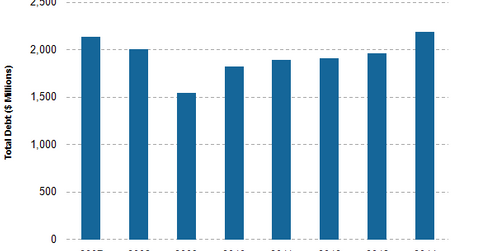
Hershey had a total debt of $2.4 billion on its balance sheet in 2014. It had a total debt-to-equity ratio of 195% during the same period.
Nov. 9 2015, Updated 7:04 p.m. ET

Hershey’s debt profile
The Hershey Company (HSY) is a major player in the confectionery industry (XLP) (IYK), with a total debt of $2.4 billion on its balance sheet in 2014. It had a total debt-to-equity ratio of 195% during the same period.
In comparison, Mondelez International (MDLZ), a major peer in the industry, had a ratio of ~60% with $16.7 billion total debt in 2014. Mondelez reported revenues of $34.2 billion in fiscal 2014, compared to Hershey’s revenue of $7.4 billion. Mondelez manufactures and markets snacks and beverages, including biscuits, chocolates, gums and candy, coffee and powdered beverages, and various cheese and grocery products.
Purpose of debt
According to its 2014 fiscal results, 70% of Hershey’s debt is long-term debt. Long-term debt is borrowed at an average rate of 4.5%, and its debt levels have been increasing since fiscal 2010. The company uses debt financing to lower its cost of capital, as debt is less costly than equity financing. So it helps the company to increase returns earned by equity shareholders. At the end of 2013, the company’s debt was $2 billion. Its debt level increased in fiscal 2014 due to the acquisition of Shanghai Golden Monkey and the short-term funds it used to grow China operations.
As of the beginning of fiscal 2015, the company had $1 billion revolving credit facility, which can be used till 2018. It also has another debt facility of $117.9 million under its lines of credit.
Credit rating and free cash flow
Hershey’s FCF (free cash flow) was $753.4 million in fiscal 2014. Hershey’s peers Mondelez and Nestle (NSRGY) had FCFs of $1.9 billion and $10.7 billion, respectively, during the same period. Hershey had a total debt-to-EBITDA (earnings before interest, tax, depreciation, and amortization) ratio of 1.4x at the end of fiscal 2014, whereas, Mondelez and Nestle had debt-to-EBITDA ratios of 3.9x and 1.3x, respectively, during the same period.
Hershey’s EBITDA-to-interest expense ratio was 18.3x. A combination of good FCFs with adequate coverage ratios indicates healthy debt levels for a company. But what are Hershey’s capital allocations for capacity expansion and innovations? Read the next part of this series to find out.
