An Analysis of the Guggenheim China Technology ETF (CQQQ)
The Guggenheim China Technology ETF (CQQQ) is a passive fund that looks to replicate the AlphaShares China Technology Index.
Nov. 20 2020, Updated 3:28 p.m. ET

An overview of the Guggenheim China Technology ETF
The Guggenheim China Technology ETF (CQQQ) is a passive fund that looks to replicate the AlphaShares China Technology Index, which measures the performance of Chinese firms operating in the technology sector. The assets under management (or AUM) for CQQQ stand at $108.5 million.
The ETF has 76 stocks listed under various subsectors. The top five holdings include Tencent Holdings (TCTZF) with a 11.47% weight, NetEase (NTES) with a 6.82% weight, Lenovo Group (LNVGF) with a 6.61% weight, Baidu (BIDU) with a 6.42% weight, and Alibaba Group Holding ADR (BABA) with a 5.37% weight. These companies comprise over 36% of the ETF’s total portfolio. BIDU constitutes 1.12% of the Power Shares ETF (QQQ).
Global investments
CQQQ has 39.07% exposure to firms listed in Hong Kong, 58.27% exposure to Chinese stocks, and 2.66% exposure to US equities.
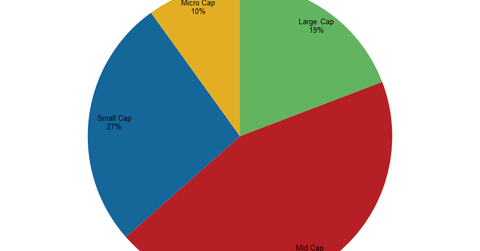
Fund capitalization
CQQQ has an exposure of 19.19% to large-cap funds, 44.24% to mid-cap funds, 26.57% to small-cap funds, and 9.93% to micro-cap funds.
Return on investments
CQQQ has generated a trailing one-month return of -4.92%, a trailing three-month return of 13.50%, a trailing six-month return of 18.67%, and a trailing twelve-month return of 22.14%. CQQQ’s year-to-date (or YTD) returns are 22.14%, while its three-year and five-year returns are 101.52% and 84.24%, respectively. The ETF is currently trading at $41.36 with a 52-week low of $33.32 and a 52-week high of $45.64.
CQQQ has an expense ratio of 0.70%, a price-to-earnings ratio of 18.16x, and a dividend yield of 0.81%.
Technical analysis
The five-day, 20-day, 50-day, and 200-day volatility for CQQQ is 133.01%, 28.57%, 30.12%, and 24.51%, respectively. The beta and standard deviation of the ETF are 2.78 and 3.08%, respectively. The ETF is currently trading above its 20-day and 60-day moving averages of $43.65 and $42.21.
