The Hammer And Hanging Man Candlestick Pattern
The Hanging Man pattern is the same as the Hammer pattern. When a Hammer pattern forms in an uptrend, it’s the Hanging Man pattern. The pattern has one candle.
Nov. 27 2019, Updated 7:25 p.m. ET

Hammer candlestick pattern
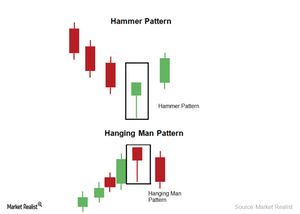
The Hammer candlestick pattern is a bullish reversal pattern in technical analysis. The pattern looks like a hammer. The pattern has one candle. The Hammer candlestick pattern forms in a downtrend. It’s considered a market bottom or a support.
The above chart shows the Hammer and Hanging Man candlestick patterns.
Hammer candlesticks form when shares fall from their opening prices due to selling pressure. However, the shares manage to recover most or all of the losses within the trading period.
The fact that prices were able to recover most of the losses throughout the intraday reflects substantial buying interest for technical, psychological, or fundamental reasons. When this happens in a downtrend, it points to a possible bottom or change in trend. As a result, it’s a reversal pattern.
Hanging Man candlestick pattern
The Hanging Man candlestick pattern is the same as the Hammer pattern. When a Hammer pattern forms in an uptrend, it’s the Hanging Man pattern. The pattern has one candle. It’s considered a resistance or market peak.
The Hanging Man pattern forms when the stock price falls from the opening price due to significant selling pressure. However, the stock retraces back within the trading period. The price action shows selling pressure for psychological or fundamental reasons. When the Hanging Man pattern forms in an uptrend, it suggests a possible market top or change in trend. So, it’s a reversal pattern.
The patterns are used to identify trends. The Hammer pattern can be used as an entry point. The Hanging Man pattern can be used as an exit point. It’s advisable to use a combination of patterns and indicators to determine your trading strategy.
