Must-read comparison: Schlumberger and its peers
Schlumberger’s yearly price-to-earnings ratio is in line with the group. Haliburton has the lowest price-to-earnings ratio.
Nov. 20 2020, Updated 1:19 p.m. ET

Comparable company analysis
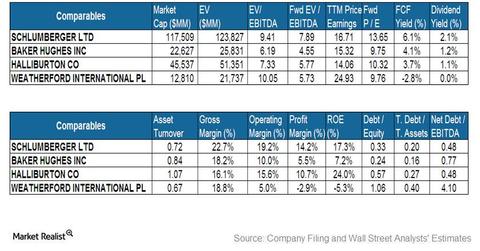
Among its peers, Schlumberger Limited (SLB) is the largest company based on market capitalization and enterprise value, or EV. It is followed by Halliburton Company (HAL), as noted in the table below.
Schlumberger is a component of the VanEck Vectors Oil Services ETF (OIH).
EV to EBITDA multiple
Baker Hughes Incorporated (BHI) has a 6.2x EV-to-EBITDA ratio, the lowest in the group, while Weatherford International (WFT) has the highest of 10.0x. The fact that Schlumberger trades at a richer EV of 9.4x—approximate summation of its equity value and net debt— when scaled by EBITDA, should not imply that it’s overvalued.
Schlumberger may have earned this privilege from the market. The company’s strong cash position and consequently relatively lower net debt, or debt less cash, its superior return metrics, or margins and coverage ratios, and the stability of its operations and earnings compared to its peers, are all good reasons for its top ranking.
Schlumberger’s 0.48 net debt-to-EBITDA ratio is one of the lowest in the group because it has a huge cash pile of $6.76 billion—the largest in the group.
Price to earnings ratio
Schlumberger’s yearly price-to-earnings ratio is in line with the group. Haliburton has the lowest price-to-earnings ratio. A higher price-to-earnings ratio typically indicates a market expectation for higher earnings growth, or superior earnings quality in terms of margins and consistency. See Part 10 of this series for a trend analysis of Schlumberger’s earnings performance.
Meanwhile, for the full year 2014, sell-side analysts project that Schlumberger’s forward-price-to-earnings ratio will be the highest, while Baker Hughes will have the lowest. Forward-price-to-earnings ratio considers the sell-side analysts’ consensus estimate of earnings for the year. This means that they expect Baker Hughes’ earnings growth to be the highest in the group. A lower ratio typically indicates strong earnings growth is expected for the period.
Baker Hughes and Haliburton are components of the VanEck Vectors Oil Services ETF.
Analysts estimate that the long-term earnings-per-share growth rate for Schlumberger is ~14%. In comparison, Baker Hughes leads the group with an estimated ~33% growth rate.
Check out Market Realist’s Energy & Power page to learn more about what’s happening in the industry.
