Why personal consumption expenditure is important to investors
The U.S. Bureau of Economic Analysis issues PCE data, and the price index is a measure of the average increase in prices for all domestic personal consumption.
Sept. 1 2020, Updated 9:47 a.m. ET

The PCE price index
The Personal Consumption Expenditure price index (or PCE) is an extremely important barometer of the changes in price levels in the U.S. The Federal Reserve started using PCE as the inflation measure that influenced its monetary policy in the year 2000.
What is PCE?
The U.S. Bureau of Economic Analysis (or BEA) issues the PCE data, and the price index is a measure of the average increase in prices for all domestic personal consumption (XLP) (XLY). 2009 is currently the base year for the index.

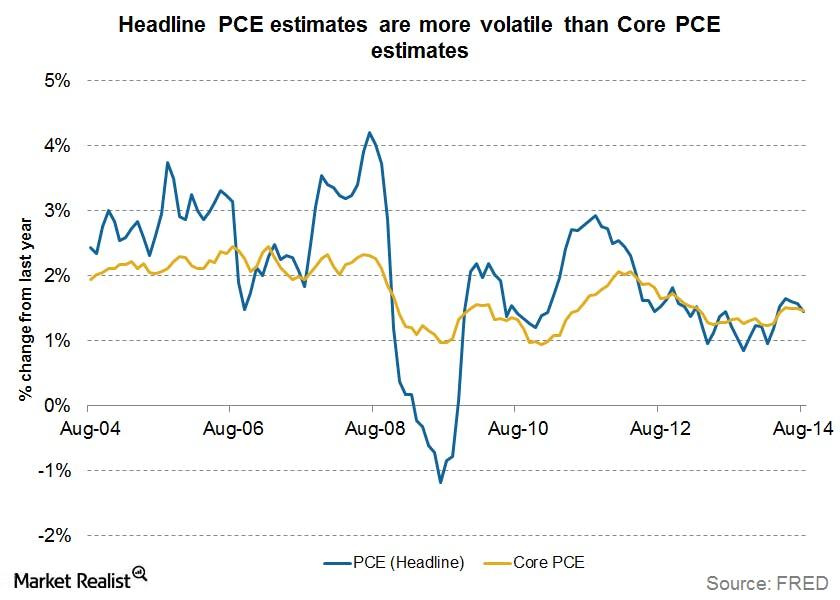
The Core PCE price index excludes data from the seasonal food and energy (XLE) items, and is therefore less volatile than the headline PCE price index measure. The above graph illustrates this trend. Core PCE is a cleaner indicator of long-term trends of inflation.
How does the BEA calculate the PCE?
The PCE price index uses the national accounts data that is also used to estimate the gross domestic product (or GDP) of the economy. The BEA bases PCE calculations on the Fisher Price index method. Expenditure data from both the current and preceding periods is used to create the index. The weights accorded to all the components of the PCE price index are re-balanced every quarter.

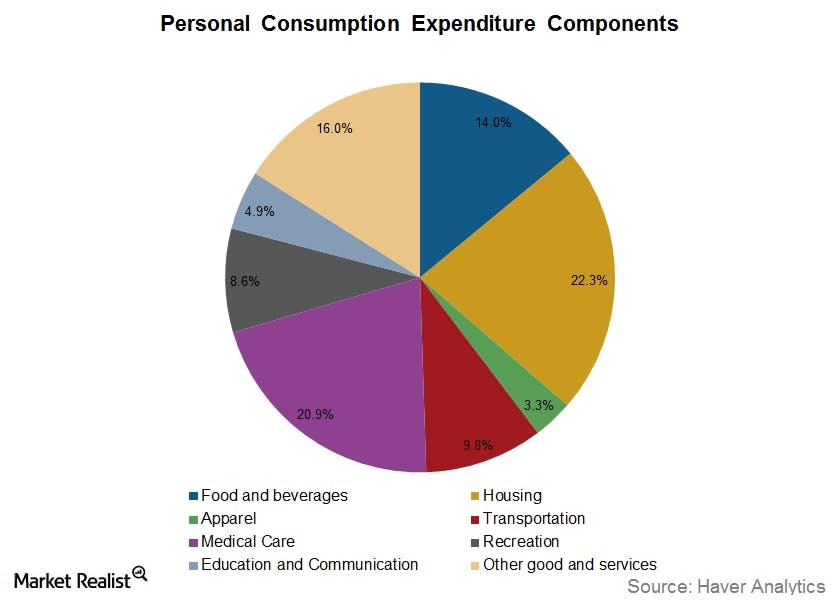
The graph above shows the weights of the components currently in the PCE. The BEA gives housing (IYR) the most weight, followed by health and medical care (XLV). The Federal Reserve used the CPI for its inflation forecasts up to 2000, and then shifted to PCE.
According to estimates by the Bureau of Labor Statistics, the average rate of inflation as measured by CPI was 2.4%, while the PCE was 2% from January 1995 to May 2013. Usually the PCE comes in lower than the CPI estimates. What is the reason behind this difference? Read on to the next part of the series to find out.
