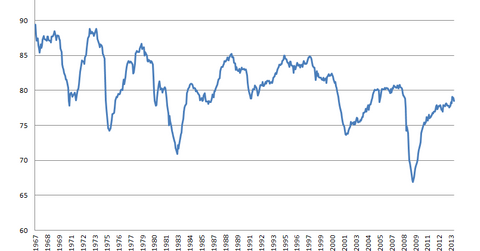
The US witnesses an unexpected drop in capacity utilization
From 1972 to 2012, capacity utilization averaged 80.2% and bottomed at 66.9% in 2009 suggesting there’s a lot of room for production to expand before we start feeling inflationary pressures.
Nov. 20 2020, Updated 11:47 a.m. ET

Capacity utilization is a bellwether of economic activity
Capacity utilization is a good top-down macroeconomic indicator that helps forecast the labor market, final demand, consumption, and inflation. While manufacturing is no longer the primary driver of the U.S. economy, it still influences the economy to a large degree—particularly for unskilled workers. U.S. manufacturing has been undergoing a bit of a renaissance lately due to cheap energy prices. While there’s still a difference between wages overseas and wages here, low natural gas prices are offsetting that difference. Also, as wages rise overseas, the cheap labor arbitrage (taking advantage of lower wages) is fading away. The Fukushima nuclear disaster also showed how elongated supply chains are vulnerable.
An increase in capacity utilization generally signals an increase in employment and capital expenditures. Lower-skilled workers have struggled since the financial crisis, which has dampened aggregate demand and consumption. Things are finally starting to improve with construction jobs on the rebound and more companies starting to move toward onshore production. Increased capital expenditures are a big economic driver as well. Corporations have been in maintenance capital expenditure mode for a long time.
Capacity utilization rates are approaching long-term historical averages
Capacity utilization was 78.5% in January, which was a drop from December. Capacity utilization has been rising steadily since the economy bottomed in 2009. Over the past year, it has risen 120 basis points. The drop in utilization was probably a fluke due to the weather and not any sort of indication of a slowdown.
From 1972 to 2012, capacity utilization averaged 80.2%. It was highest in the early 1970s, peaking at around 89%. It bottomed at 66.9% in 2009. This suggests there’s a lot of room for production to expand before we start feeling inflationary pressures. High capacity utilization levels in the 1970s were a big cause of inflation.
Impact on commercial REITs
Industrial production and capacity utilization are numbers that get a lot of focus at the Fed. These figures not only help forecast economic activity, but also act as important inputs into inflation. Once the Fed believes inflation is too low, the outlook will change. The Fed certainly will be happy to see capacity utilization approaching long-term historical averages.
While inflation is completely under control, the Fed will take capacity utilization into account when formulating policy. Right now, the only economic statistic that really matters is unemployment—everything else is secondary. While quantitative easing’s days are numbered, low short-term interest rates will be here for at least another year or two.
Interest rates are an important input for the commercial REIT sector, as they tend to be leveraged and will also trade based on their dividend yields. While increases in interest rates may not necessarily be welcome news for office REITs like Brookfield Office Properties (BPO), SL Green (SLG), Vornado (VNO), Kilroy (KRC), or Highwoods (HIW), the reason for the increase is good news—higher capacity utilization signals stronger economic growth, which is an important driver of rental income and vacancy rates.
