An investor’s guide to cyclical and counter-cyclical industries
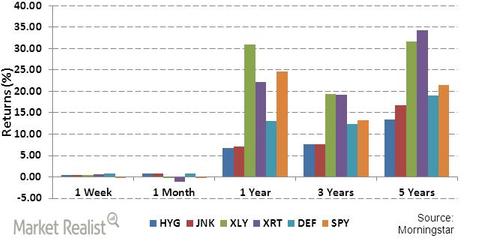
XLY and XRT have performed better in terms of absolute returns over longer periods of three and five years
Feb. 24 2014, Published 5:53 p.m. ET

What is cyclical industry?
A cyclical industry can generally be defined as the one which follows the business cycle or trend in economy. These industries earn higher revenues. So, they provide higher returns in periods of economic boom or expansion; conversely, their revenue and returns get lower as the economy contracts. Cyclical industries are sensitive to economy in varying degrees. Companies in cyclical industries usually try to maintain profitability by undertaking various restructuring measures that minimize cost structure; some industries also experience consolidation due to attractive valuation. The main drivers of cyclicality are business cycle, mismatch, and delay between different market dynamics including investment, capacity, price, and sales. The other major driver is technology. Cyclical industries include those that produce durable goods such as raw materials and heavy equipment. The stock price of the companies belonging to cyclical industry has a tendency of upward movement in times of economic growth and goes down during an economic recession.
An ETF investor would be interested in knowing how the ETF which tracks an index that consists of cyclical industry stocks performs relative to a broad market index like S&P 500, or SPY which tracks the S&P 500 Index.
What is counter-cyclical industry?
Counter-cyclical or defensive industries are those that do well in economic downturns, since demand for their products and services continue regardless of the economy. It’s a niche industry financial performance negatively correlated to the overall state of the economy. Some examples of non-cyclical industries would be pharmaceutical, educational service, insurance carriers, and public service industries. While it’s incorrect to label a particular industry as cyclical or counter-cyclical, the nature of their movement (for example, revenue, stock price, etc.) essentially gives an indication of their characteristics.
It’s quite evident from the graph above that from our portfolio, XLY and XRT have performed better in terms of absolute returns over longer periods of three and five years; XLY has outperformed others in the past one and three years while XRT has produced the best returns in the past five years. The majority holdings of XLY are Comcast Corporation, Amazon.com, Inc., Walt Disney Company, Home Depot, Inc., and McDonald’s Corporation. In the past five years, CMCSA has posted returns of 33.44%; Amazon had returns of 40.51%; Walt Disney returned 36.2%; Home Depot had 33.6% returns; and McDonald’s had returns of 14.75%. The majority holdings of XRT are Francesca’s Holdings Corp., Netflix, Inc., Abercrombie & Fitch Company, and Cabela’s, Inc. In the past three years, the returns from these holdings were 22.6% (Netflix), -14.5% (Abercrombie & Fitch Company); and 29.5% (Cabela’s). So, it’s clear that the performance of the stocks that constitute the ETF contributed to the superior performance of the cyclical ETFs.
It should be noted that XLY had been more volatile than the rest while DEF was least volatile. When we compare cyclical industry ETFs versus high yield bond ETFs across our time periods for absolute return and volatility (in the later part of this series), we will find out the benefits of holding bond ETFs in the portfolio.
