Darden analysis: Why revenue per square foot is essential
Average revenue per square foot To get a better picture of Darden’s business, we further looked into casual dining restaurants’ average revenue per square foot—the square feet of restaurants across primarily the United States and their guest traffic. This will help us decide whether Darden’s Olive Garden and Red Lobster brands should pick up a […]
Nov. 1 2013, Published 9:00 a.m. ET

Average revenue per square foot
To get a better picture of Darden’s business, we further looked into casual dining restaurants’ average revenue per square foot—the square feet of restaurants across primarily the United States and their guest traffic. This will help us decide whether Darden’s Olive Garden and Red Lobster brands should pick up a premium strategy or go for a lower-cost model.
Revenues per square foot fall close to each other
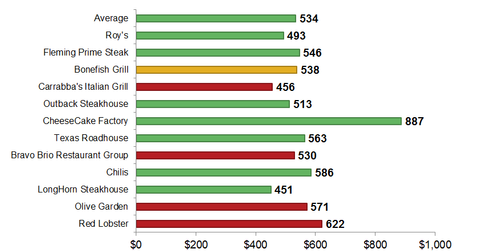
The chart above shows the average revenues generated per square foot for Darden’s core brands and its major competitors. (Some non-core competitors are also included.) We derived these from the companies’ average square feet per restaurant, the number of company-operated stores in the United States, and company-operated revenues for the specific brands whenever possible. If you search for “square feet” or “square foot” within a company’s annual filings, you can quickly retrieve those figures.
Measuring sales and returns on limited resources
What we want to figure out is a brand’s ability to generate returns or sales based on a limited resource. The two variables that affect revenue are price and volume. Although measures like return on capital, assets, and equities are commonly used to value stocks, restaurant stocks’ balance sheets can differ significantly, depending on whether they own or lease restaurant land and properties. Of course, a more detailed analysis would be one that takes into account the average capital cost to set up the place.
The Cheesecake Factory stands out
Based on the chart above, we see that the average revenue per square foot generally concentrates around $534 for most casual dining restaurants. Cheesecake Factory Restaurant Inc. (CAKE) is an exception, boasting $887 per square foot a year, according to the company. The higher revenue per square foot appears to be caused by the Cheesecake Factory’s more upscale looks, possibly a higher guest turnover (if you’ve been to the Boston location, you know it’s always crowded), and a dessert section where customers can just purchase delicious cakes and take them home.
Darden has higher sales per square foot
Darden’s Olive Garden and Red Lobster generate higher revenues compared to peer brands like Carrabba’s Italian Grill and brands under Bravo Brio Restaurant Group Inc. (BBRG). Darden’s LongHorn Steakhouse appears to be underperforming, which is an opportunity if the company can increase the brand’s overall sales. This should translate to higher earnings. Olive Garden and Red Lobster’s higher sales per square foot could reflect brand value. So perhaps not all is bad for Olive Garden and Red Lobster. Let’s take a deeper dive into Darden’s revenue.
