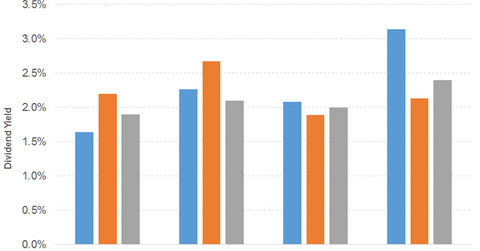
Dividend Yield of W.W. Grainger
W.W. Grainger’s (GWW) PE ratio of 16.3x compares to a sector average of 29.3x. The dividend yield of 3.2% compares to a sector average of 1.6%.
Aug. 23 2017, Published 12:43 p.m. ET

W.W. Grainger: Services sector, industrial equipment wholesale industry
W.W. Grainger (GWW) dispenses MRO (maintenance, repair, and operating) supplies and other associated products and services for businesses and institutions. Sales for the company have grown at a slow pace over the years through fiscal 2016. All the segments, especially the United States and Canada, reported a fall in sales, partially offset by other businesses. The Canada segment suffered an oil and gas sector decline in Alberta along with declines in all other end markets across the country. Rising operating expenses contributed to a fall in operating earnings. EPS (earnings per share) for fiscal 2016 fell, mainly due to higher interest expenses and the loss from equity investments, partially offset by share buybacks.
The story remained the same for the first half of 2017. This time, the United States and other businesses posted growth, partially offset by Canada.
In the graph below, we can see W.W. Grainger’s dividend yield compared to the S&P 500 and Applied Industrial Technologies (AIT). (The asterisk in the graph denotes an approximation in calculating dividend yield.)
Consistent growth for 46 years
W.W. Grainger (GWW) has recorded consistent growth in dividends for 46 successive years. Free cash flow has seen a growing trend. Its dividend yield has grown over the years and is currently beating the S&P 500.
The company’s PE (price-to-earnings) ratio of 16.3x compares to a sector average of 29.3x. The dividend yield of 3.2% compares to a sector average of 1.6%. In the graph below, we can see W.W. Grainger’s price movement compared to the S&P 500 and Applied Industrial Technologies.
W.W. Grainger has reduced its 2017 sales outlook to 1.0%–4.0%, from 2.0%–6.0%. Its EPS outlook has been reduced from the initial guidance of $11.30–$12.40 to $10–$11.30. The company intends to ramp up investments in its supply chain, e-commerce abilities, information systems, sales force productivity gears, and inventory management services. These are focused on increasing business efficiency in the United States and buttressing its Canadian business for growth in fiscal 2017.
The WisdomTree US Dividend Growth ETF (DGRW) offers a dividend yield of 2.8% at a PE ratio of 20.3x. The diversified ETF has a substantial exposure to technology. The WisdomTree Emerging Markets Equity Income ETF (DEM) offers a dividend yield of 3.5% at a PE ratio of 10.6x. The geographically diversified ETF has a substantial exposure to financials.
