Analyzing How Dow Chemical Stock Has Performed in 2017
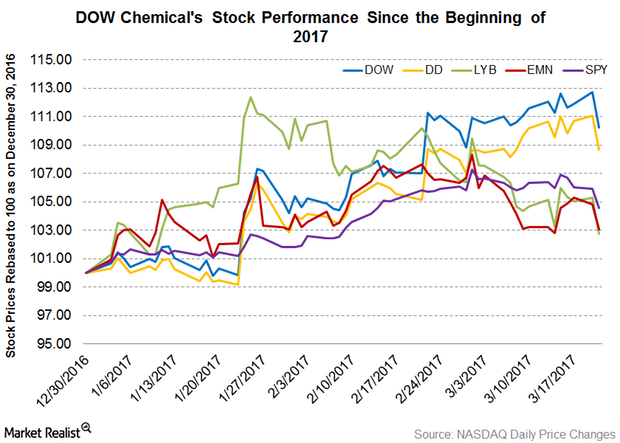
From the beginning of 2017 to March 21, 2017, Dow Chemical (DOW) has been an outstanding performer. It rose 10.20% and outperformed SPY.
March 22 2017, Published 10:50 a.m. ET
Dow Chemical stock
From the beginning of 2017 to March 21, 2017, Dow Chemical (DOW) has been an outstanding performer. It rose 10.20% and outperformed the broad-based SPDR S&P 500 ETF (SPY). SPY has returned 4.6%. Dow Chemical also outperformed its peers DuPont (DD), Eastman Chemical (EMN), and LyondellBasell (LYB). They returned 8.7%, 3.0%, and 2.8% during the same period.
Dow Chemical’s strong performance is primarily driven by better-than-expected 4Q16 earnings and positive developments in the Dow Chemical-DuPont merger. European Union regulators are reviewing the merger.
Moving average and relative strength index
Dow Chemical’s higher stock price widened the 100-day moving average price gap. Dow Chemical traded 7.9% above its 100-day moving average price of $58.47. It indicates an upward trend in the stock. Dow Chemical’s 52-week low is $47.51, while its 52-week high is $64.73.
The 14-day RSI (relative strength index) of 52 indicate that the stock isn’t overbought or oversold. An RSI score of 70 means that a stock moved temporarily into an overbought situation. An RSI score below 30 indicates that a stock moved temporarily into an oversold position.
In this series, we’ll look at Dow Chemical’s latest dividend announcement, dividend yields, analysts’ latest recommendations, and its recent valuations.