How Mondelez Compares to Its Peers’ Key Moving Averages
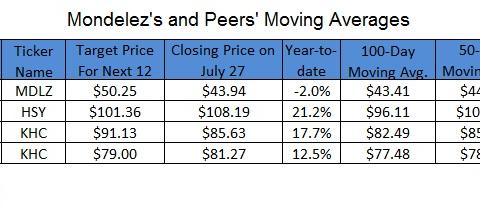
On July 27, Mondelez closed at $43.94. The stock is trading 1.2% above its 100-day, 1.4% below its 50-day, and 2.9% below its 20-day moving averages.
Aug. 5 2016, Updated 9:04 a.m. ET

Moving averages
On July 27, 2016, Mondelez (MDLZ) closed at $43.94. The stock is trading 1.2% above its 100-day, 1.4% below its 50-day, and 2.9% below its 20-day moving averages, respectively. Mondelez’s peers in the industry include Hershey (HSY), Kraft Heinz (KHC), and Kellogg (K).
Hershey closed at $108.19 on July 27. This was 13% above its 100-day moving average, 8% above its 50-day moving average, and 1% below its 20-day moving average. On July 27, Kraft Heinz closed at $85.63. This was 3.8% above its 100-day, 0.4% and 3.1% below its 50-day, and 20-day moving averages, respectively.
Kellogg is trading 5% and 3.3% above its 100-day and 50-day moving averages and 1.8% below its 20-day moving average, respectively. Kellogg closed at $81.27 on July 27. The First Trust Consumer Staples AlphaDEX Fund (FXG) invests 5.1% of its holdings in Mondelez. It closed at $48.31 on July 27. The First Trust NASDAQ-100 Equal Weighted IndexSMFund (QQEW) also invests in Mondelez.
Analyst estimates
Analysts’ estimates indicate rises of 14% for Mondelez and 6% for Kraft Heinz over the next 12 months. Meanwhile, Hershey and Kellogg already beat estimates by 6% and 3%. As of July 27, Mondelez, Hershey, Kraft Heinz, and Kellogg saw YTD (year-to-date) returns of -2%, 21%, 18%, and 12%, respectively. FXG has risen 8.7% YTD.
