Auto Industry Indicators: What Do Recent Vehicle Sales Data Suggest?
The US auto industry has witnessed good times in the past couple of years. In 2015, US auto sales were at their highest, with 17.4 million vehicles sold.
June 23 2016, Published 4:06 p.m. ET

Auto industry indicators
The auto manufacturing business is widely known for having high fixed and variable costs. Apart from the high fixed cost involved in plants and machinery, there are many other variable costs related to raw materials that impact the profitability of an automaker.
Similarly, economic data released weekly and monthly reflect upcoming trends in auto sales. Before we begin analyzing some of this important data, let’s take a look at US auto industry sales figures.
May 2016 US auto sales
The US auto industry has witnessed good times in the past couple of years. In 2015, US auto sales were at their highest, with 17.4 million vehicles sold during the year. This certainly boosted the confidence of automakers, but it also ignited a debate about US auto sales being at peak levels and a possible downturn in the US auto demand going forward.
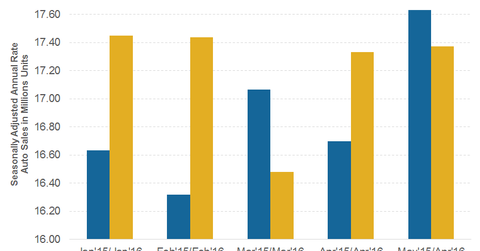
In May 2016, US auto sales SAAR (Seasonally adjusted annual rate) stood at 17.37 million vehicle units. This was slightly higher than the US auto sales SAAR figures for the month of April 2016, which stood at 17.33 million vehicle units.
Driving auto stocks downward
Moreover, since the beginning of this year, concerns about US auto demand (XLY) being at its peak have negatively affected automakers’ stock price movements. Note that Fiat Chrysler Automobiles (FCAU) mentioned in its 4Q15 earnings report that it considers 2015–2016 to be the peak year for US auto demand. This has further boosted debates about whether US auto demand is really at its peak.
Other major automakers such as General Motors (GM), Ford (F), and Toyota (TM) expect the upward trend in US auto demand to continue in the year to come.
Series overview
In this series, we’ll take a look at key economic indicators that auto industry investors can track to get a fair idea about possible trends in auto sales. We’ll also analyze how the housing industry is driving growth in the US pickup truck segment. Later, we’ll take a look at some cost related factors that may affect the profitability of automakers.
Let’s start with industrial production.
