An Economic Look at the Great Depression Versus Today
In what ways was the Great Depression different from—and similar to—today's economic crisis?
Nov. 16 2020, Published 12:54 p.m. ET
Statistics seemingly follow us everywhere. The seasonally adjusted U.S. unemployment number for October 2020 is 11.1 million. There were 181,196 new COVID-19 cases reported throughout the nation on Nov. 13 alone. The February 2020 stock market crash caused the Dow Jones Industrial Average to fall by more than 2,000 points. That's a lot of numbers to take in, and it can make us feel like we're back in the Great Depression.
The coronavirus pandemic has undoubtedly recessed the market. How does today's economy stack up to the Great Depression, which took place almost a century ago?

What defines the Great Depression?
The Great Depression was the worst economic downturn in the world since industrialization. Starting in 1929, the Great Depression lasted for a decade. The Great Depression impacted a lot more than America. Europeans also felt the impact.
During the roaring 1920s, the stock market expanded rapidly. Also, the wealth in America just about doubled during the decade. Stock prices lingered at their peak even as unemployment started to rise. Experts said that people were invested beyond their means. Future earnings didn't jive with wildly high invested capital.
The stock market crash took place on October 24, 1929. That day, otherwise known as Black Tuesday, saw 12.9 million shares sold.
Dow Jones during the Great Depression
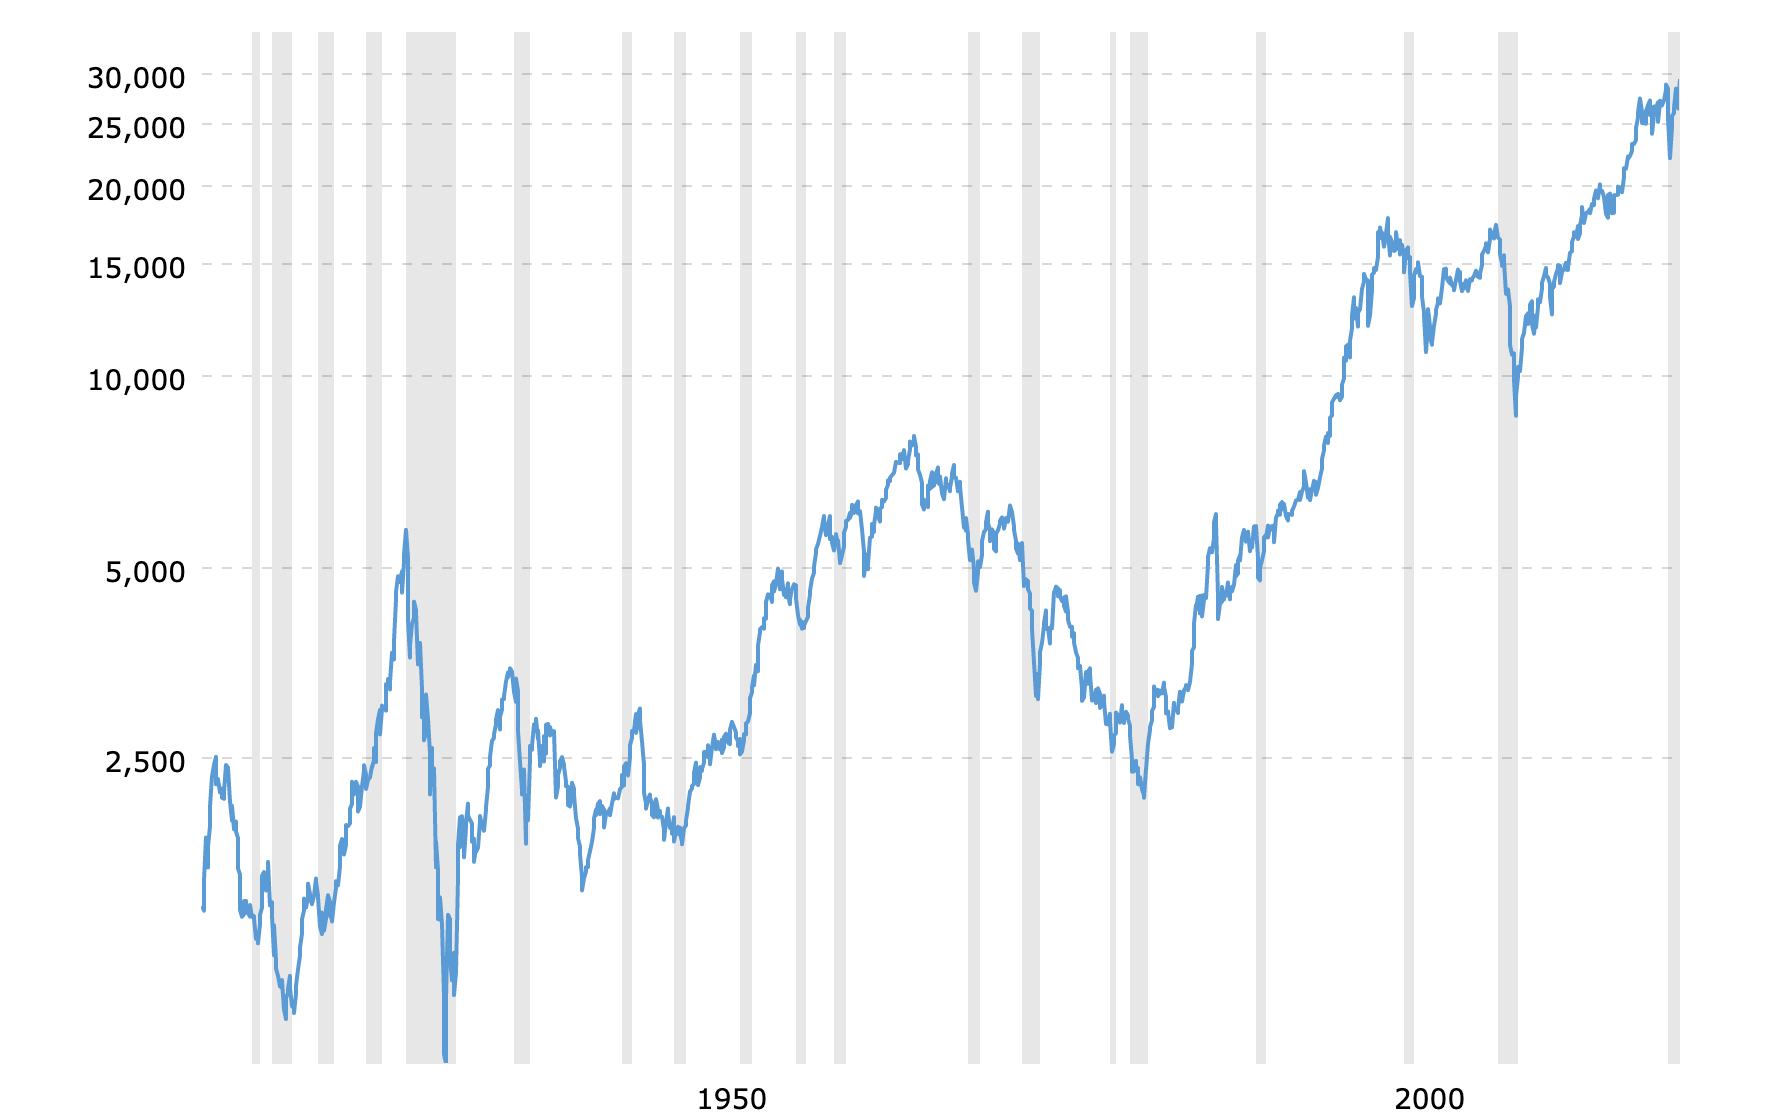
On September 3, 1929, the Dow Jones Industrial Average peaked at 381.17 points. It began dropping by late October, but it had yet to reach its lowest point yet. This bear run continued on until July 8, 1932, when the Dow was at a heart-wrenchingly low 41.22 points.
Most of the struggle for the Dow came in the form of small-cap, value, and speculative stocks. Index delisting was commonplace due to bankruptcy declarations galore. It took 25 years for the Dow to reach its 1929 high again.
On Feb. 12, 2020, the Dow hit an all-time high for that time of 29,551.42 points. This came after the largest bull market ever, even including the 6.26 percent drop on Feb. 5. The Dow's lowest point of 2020 came on Mar. 25 when it hit 20,704.91 points. The Dow hit another all-time high on Nov. 16 at 29,920.20 points—up 400 in response to COVID-19 vaccine news.
Dow Jones Great Depression chart
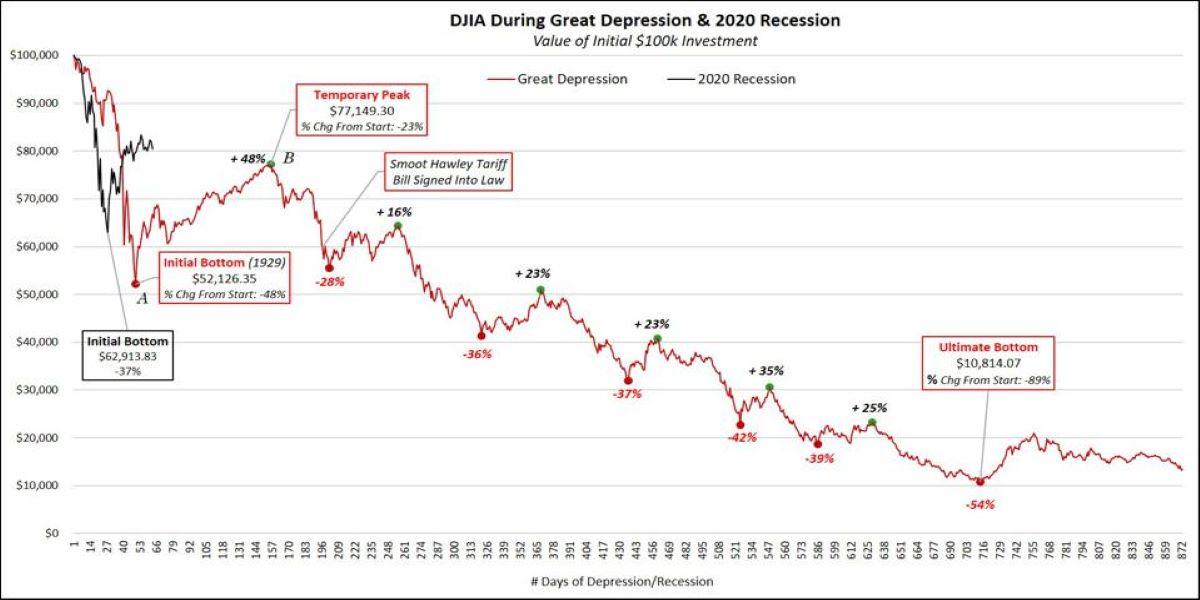
While the Dow index is on a different echelon than it was 91 years ago, you can compare the effects of a similarly sized investment. That's what the following chart does with the 2020 recession and the Great Depression.
The following chart shows the actual levels of the Dow from then to now, adjusted for index changes and inflation.
U.S. population during the Great Depression and now
As of 2019, there were 328.2 million people in America. In 1930, the U.S. population was just 123.1 million.
Great Depression unemployment numbers
The Great Depression is known for unemployment. In 1933, the unemployment rate for the country was at its highest. It reached 24.9 percent, which is just about a quarter of the population able to work.
That's much higher than the unemployment peak of 14.7 percent in 2020, which occurred in April. As of October 2020, that number is down to 6.9 percent (more than twice as much as the February rate). With COVID-19 cases rising dramatically, it's uncertain whether the unemployment rate will continue to decline.
When did the Great Depression end?
The Great Depression ended in 1939, a full 10 years after it began. While today's economic crisis isn't exactly the same, in some ways, it's eerily similar.


