Buy and Sell Signals in the Stock Market, Explained
The market is always moving, but buy signals and sell signals can help you make educated trading decisions.
April 30 2021, Published 2:58 p.m. ET

The stock market is constantly moving, and even the most prominent experts agree that short-term occurrences are largely unpredictable. However, there are signals that help you figure out when is the best time to buy and sell a security.
What do these buy and sell signals look like and how can you incorporate them into your trading practice?
Buy signals in the stock market
A buy signal is a circumstance that alerts an investor that it's time to enter a position.
Using buy signals helps bring some semblance of order to a trader's investment strategy. As an investor, you might focus on quarterly momentum, moving averages, trading volume, and other long and short-term tactics. Your particular set of strategies depends on your prime investment theories.
How to look for buy signals in stocks
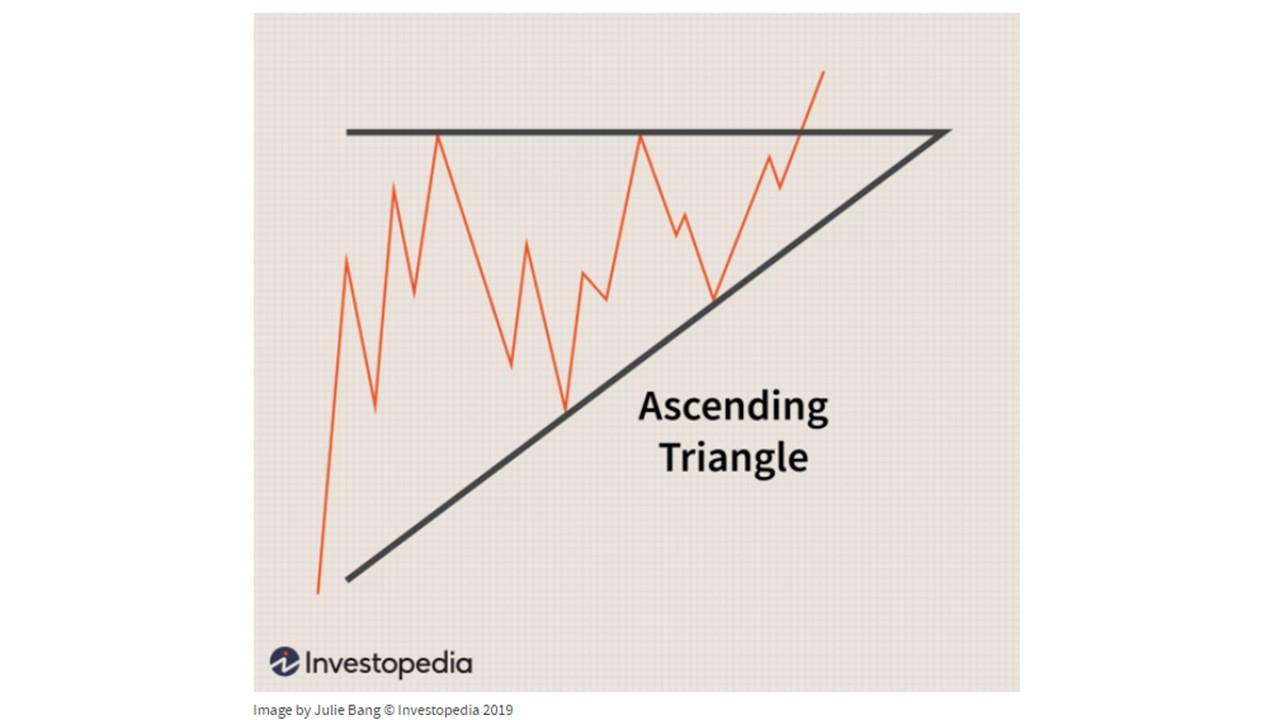
A lot of people use charts to generate buy signals. For example, a chart pattern like an ascending triangle pattern is a buy signal for many investors. As the price goes down within the triangle, an investor might buy in to take advantage of the upcoming return.
There are also technical indicators, with one of the most common being RSI (relative strength index). After calculating average gains divided by average losses, you'll come up with a number that can tell you if a stock is overbought or oversold. An RSI below 30 is largely considered to be oversold, which might signal a buy for some traders.
Then, there's the notion of intrinsic value, which helps traders determine the value of a stock without subjective or external market factors. If the market is currently trading a stock below its proposed intrinsic value, it can be a buy signal.
To calculate the intrinsic value of a stock, you can use three methods:
- Discounted cash flow analysis
- Financial metric analysis (i.e. earnings per share)
- Asset-based valuation
There's an intrinsic value formula specifically for options, which can help traders set up appropriate contracts.
Automated buy signals tend to face quite a bit of scrutiny since they're much more touch-and-go than automated sell signals. However, algorithmic improvements could change the name of the game. In the meantime, you can set a buy stop order to keep your trade from going through at a higher market value than you wanted.
What are sell signals in the stock market?
A sell signal is a circumstance that alerts an investor that it's time to exit a position.
There are two broad categories of sell signals:
- Fundamental
- Technical
For fundamental analyses, traders will often look at discounting, debt signaling, PE (price per earnings), and slowed earnings growth.
For technical analyses, traders will often look at triangle patterns (as well as other chart patterns), moving averages, and RSI below 30 (oversold) or above 80 (overbought).
You can also look at the stock's short interest (a high short interest without the prospect of a squeeze could be a sell signal). The sentiment is non-quantitative, but legal news like antitrust investigations are important in sell signals.
How to incorporate and automate sell signals
Unlike buy signals, it's easy to automate sell signals. The most common way to do this is with a stop-loss order.
When you buy a stock, you can set a stop-loss for a specific lower price than your cost basis (i.e. a five percent loss). This will cue the trading platform to sell your stock when you hit that specified loss. It can help you avoid losing more money than you have to.


