FireEye Is Trading at a 26% Discount to Average Analyst Estimates
Cybersecurity (HACK) stock FireEye (FEYE) has taken investors on a volatile ride over the last few years.
Aug. 18 2020, Updated 5:34 a.m. ET

Stock returns
Cybersecurity (HACK) stock FireEye (FEYE) has taken investors on a volatile ride over the last few years. The stock generated returns of -16% in the last 12 months. Since the start of 2019, the stock is down by 1.5%. The stock has fallen 7.7% in the last three years and 65% in the last five years.
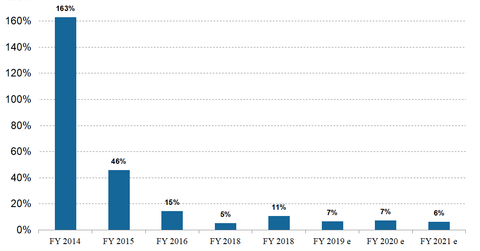
FireEye has burnt significant investor wealth. There have been concerns over the company’s slowing revenue growth. The company is also nowhere close to achieving GAAP profitability. Sales rose 163% in 2014, 46% in 2015, 14.6% in 2016, 5.2% in 2017, and 10.7% in 2018.
FireEye stock is currently trading 23% below its 52-week high of $20.61 and 12% above its 52-week low of $14.20. With an RSI (relative strength index) score of 40, PANW stock is trading closer to oversold territory.
Is FireEye stock overvalued?
Revenue is expected to rise by 6.7% in 2019 and 7.4% in 2020. Earnings though are estimated to rise at a CAGR of 114% over the next five years. The stock is trading at 3.7x its revenue. FireEye is growing revenue by single digits compared to the market growth of 17% achieved in the fourth quarter of 2018.
FireEye also competes with tech giants such as Cisco (CSCO), Palo Alto Networks (PANW), Fortinet (FTNT), CheckPoint (CHKP), and Symantec (SYMC), which account for over 50% of cybersecurity sales. Is robust earnings growth enough for FireEye stock to be attractive? Is the stock at the cusp of a turnaround? Let’s look at what Wall Street thinks.
Analyst recommendations
Of the 29 analysts covering FireEye, 11 have given it “buy” recommendations, 17 have given it “hold” recommendations, and one has given it a “sell” recommendation. The average 12-month target price for FireEye is $20.15, which indicates a potential upside of 26% from its current level.
