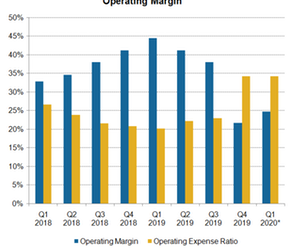
NVIDIA’s Operating Expenses Exceed Its Operating Profits
NVIDIA’s non-GAAP operating expenses increased 3% sequentially to $755 million in fiscal 2019’s fourth quarter as the company continued to invest in gaming, data centers, and automotive.
Nov. 20 2020, Updated 5:13 p.m. ET

NVIDIA’s operating leverage
Previously, we saw that NVIDIA’s (NVDA) gross profit fell 36.4% sequentially as weaker-than-expected demand of Turing-based GeForce RTX GPUs (graphics processing units) boosted its inventory of memory and other components. Its gross margin’s weakness trickled down to its operating margin.
NVIDIA’s non-GAAP operating expenses increased 3% sequentially to $755 million in fiscal 2019’s fourth quarter as the company continued to invest in gaming, data centers, and automotive. The company’s narrower gross margin and higher operating expenses saw its non-GAAP operating profit fall faster than its revenue and gross profit. Its operating profit fell 60% sequentially to $479 million, and its operating margin narrowed sequentially to 21.7% from 38%.
The significant revenue declines in the fourth quarter of fiscal 2019 expanded NVIDIA’s operating expense ratio to 34%, wider than its operating margin of 21.7%. Rival Advanced Micro Devices (AMD) has been operating at higher expenses and narrow margins for more than three years. In the fourth quarter, AMD’s 7.7% operating margin was much narrower than its 33.4% operating expense ratio.
NVIDIA’s operating margin guidance
NVIDIA expects its operating expenses to be higher than its operating profits in fiscal 2020’s first quarter as well, with its operating expense ratio staying at 34% and its operating margin improving to 24.7% sequentially. Intel (INTC) also expects its operating expense ratio to surpass its operating margin in the first quarter as its revenue growth slows and expenses rises. It expects an operating expense ratio of 32.6% and an operating margin of 29%.
EPS
NVIDIA’s non-GAAP EPS fell 57% sequentially to $0.80 in fiscal 2019’s fourth quarter. Its EPS decline was slower than its operating income decline of 60% as the company repurchased $724 million in stock during the quarter. In fiscal 2019, its EPS rose 35% YoY (year-over-year) to $6.64. Analysts expect the company’s EPS to fall 19% YoY to $5.40 in fiscal 2020. Lower EPS reduce its cash flow, which we’ll look at next.
Check out all the data we have added to our quote pages. Now you can get a valuation snapshot, earnings and revenue estimates, and historical data as well as dividend info. Take a look!
