Weatherford’s Stock Price Forecast
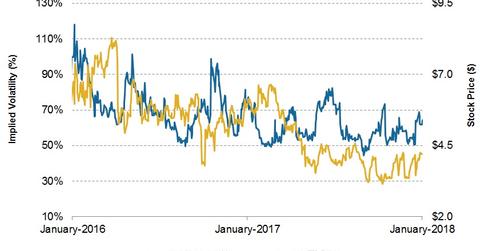
On January 16, Weatherford International’s (WFT) implied volatility (or IV) was ~64%. Its 3Q17 earnings were announced on November 1, 2017. Since then, its implied volatility has increased from 54% to the current level.
Jan. 19 2018, Updated 10:35 a.m. ET

Weatherford’s implied volatility in context
On January 16, Weatherford International’s (WFT) implied volatility (or IV) was ~64%. Its 3Q17 earnings were announced on November 1, 2017. Since then, its implied volatility has increased from 54% to the current level. Since November 1, 2017, WFT’s stock price has increased 14%. Implied volatility indicates a stock’s potential movement according to options traders. IV tends to decrease in a bullish market and increase in a bearish market.
Crude oil’s volatility
Since November 1, 2017, crude oil’s implied volatility has decreased from 23% to 19%. WFT is 0.26% of the iShares US Energy ETF (IYE). IYE has increased 11% since November 1, 2017, compared to a 14% rise in WFT’s stock price during this period.
Implied volatility: Comparison with peers
National Oilwell Varco’s (NOV) implied volatility on January 16, 2018, was ~33%, which implies that NOV’s stock price can range between $41.90 and $35.04 in the next seven days. Halliburton’s (HAL) implied volatility was 27.5% January 16, which implies HAL’s stock price can vary between $54.12 and $50.14 in the next seven days. Read about HAL’s pre-earnings analysis in Market Realist’s Analyzing Halliburton before Its 4Q17 Earnings. McDermott International’s (MDR) implied volatility was 43% on January 16, which implies that MDR’s stock price could range between $8.28 and $7.34 in the next seven days.
Next in this series, we’ll discuss investors’ short interest in WFT’s stock as indicated by its short interest.
