AMD Lowers Leverage Ratio and Strengthens Balance Sheet
AMD has been using its cash flow to increase and maintain its cash reserve above $1 billion.
Nov. 20 2020, Updated 1:07 p.m. ET

AMD’s cash and debt balance
Previously, we saw that Advanced Micro Devices (AMD) ended 2018 with a negative FCF (free cash flow) of $129 million because its money was stuck in accounts receivable. A company can use FCF to repay excess debt, improve its cash reserves, or give returns to shareholders. AMD doesn’t give returns to shareholders through dividends or stock buybacks, as it has been struggling to report positive FCF.
AMD has been using its cash flow to increase and maintain its cash reserve above $1 billion. At the end of 2018, AMD’s cash reserve stood at $1.16 billion and total debt at $1.53 billion, resulting in net debt of $370 million. Rival NVIDIA (NVDA) enjoys a net cash position of over $5.5 billion, which puts it in a better position than AMD to withstand a crisis.
Debt repayment
In 2018, AMD repaid $171 million in debt, resulting in total principal debt of $1.53 billion. It paid off its most expensive debt first and retained the cheaper debt to use that money in the business. The company has $66 million of debt due in 2019, which it expects to pay in March 2019. Its next long-term debt maturity will come in 2022.
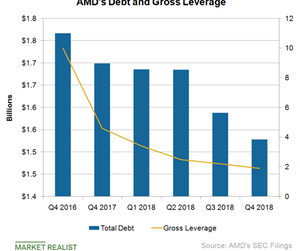
AMD is in a far better position to repay its debt than it was two years ago when it had a net debt of $500 million and gross leverage of 10.0x.
AMD’s leverage ratio
The gross leverage ratio tells us about a company’s ability to repay its debt. It is calculated by dividing total debt with annual adjusted EBITDA (earnings before interest, tax, depreciation, and amortization). In 2018, AMD reduced its gross leverage to 1.9x from 4.6x at the end of 2017, meeting its long-term gross leverage target of 2.0x. The company improved its leverage by repaying $171 million in debt and increasing its adjusted EBITDA by $435 million in 2018.
A lower leverage ratio shows that AMD earns enough profit from its operations to meet its debt obligation. Next, we will look at the efficiency of the company’s management.
Check out all the data we have added to our quote pages. Now you can get a valuation snapshot, earnings and revenue estimates, and historical data as well as dividend info. Take a look!
