Who Has Higher Gross Margins: Alibaba or Amazon?
Alibaba’s gross profit improved 14% to 37.2 billion yuan ($5.6 billion) in the quarter ended June 30, 2018.
Sept. 25 2018, Updated 5:25 p.m. ET

What drove Alibaba’s gross margins?
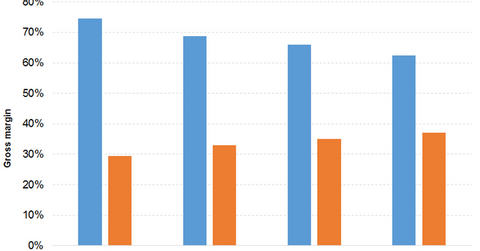
Alibaba’s (BABA) gross profits increased at a three-year CAGR (compound annual growth rate) of 40% to 143.2 billion yuan ($22.8 billion) in the fiscal year ended March 31, 2018. Higher revenue growth partially offset by increased cost of revenue led to the growth, which improved 45% in 2018 compared to 34% in 2015. However, its gross margin reduced from 69% in 2015 to 57% in 2018.
Alibaba’s gross profit improved 14% to 37.2 billion yuan ($5.6 billion) in the quarter ended June 30, 2018. Its revenue growth for the period was affected by higher cost of revenue growth. Its gross margin fell from 65% in the June 2017 quarter to 46% in the June 2018 quarter.
Understanding Amazon’s gross margins
Amazon’s (AMZN) gross profit increased at a three-year CAGR of 36% to $65.9 billion in the fiscal year ended December 31, 2017. Sustained growth in sales, partially offset by higher cost of sales, led to its gross profit growth, which improved 35% and 38% in 2015 and 2017, respectively. Its gross margin increased from 29% in 2014 to 37% in 2017.
Its gross profit grew 53% to $42.6 billion in the six months ended June 30, 2018. Its sales growth was affected by the cost of sales for the period. Its gross margin improved from 38% in the six months ended June 30, 2017, to 41% in the six months ended June 30, 2018.
Gross profits of peers
JD.com’s (JD) gross profit was 50.8 billion yuan ($7.8 billion) in 2017 and 30.6 billion yuan ($4.6 billion) in the six months ended June 30, 2018.
Walmart (WMT) had a gross profit of $126.9 billion and $63.4 billion in the fiscal year ended January 31, 2018, and the six months ended July 31, 2018, respectively.
In the next part of this series, we’ll focus on Alibaba’s and Amazon’s operating expenses.
