Oracle’s Valuations Compared with Its Industry Peers
In the September 7 trading session, Oracle stock closed at $47.81, close to its lower Bollinger Band level of $47.54.
Sept. 14 2018, Updated 7:32 a.m. ET

Oracle’s valuation metrics comparison
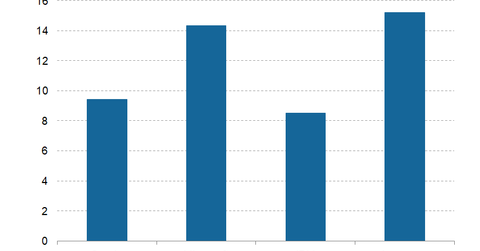
On September 7, Oracle (ORCL) was trading at a forward EV-to-EBITDA multiple of ~9.42x, which is a 34.0% discount to its overall market peers. Among its peers, Microsoft (MSFT), IBM (IBM), and Accenture (ACN) had forward EV-to-EBITDA multiples of ~14.31x, ~8.46x, and ~15.23x, respectively.
From the graph below, we can see the forward EV-to-EBITDA multiples for IBM, Microsoft, Accenture, and Oracle.
On September 7, Oracle was trading at a forward PE (price-to-earnings) multiple of ~13.86x. On the same date, Microsoft, IBM, and Accenture had forward PE multiples of ~24.18x, ~10.41x, and ~23.07x, respectively.
Bollinger Band and RSI
In the September 7 trading session, Oracle stock closed at $47.81, close to its lower Bollinger Band level of $47.54. This value indicates that the stock is in “oversold” territory, which investors could take as a buy signal.
Oracle’s RSI (relative strength index) for the last 30 trading days is 49.28, acting as a support to its stock price. An RSI reading above 70 indicates that a stock is in “overbought” territory, and an RSI reading below 30 is in “oversold” territory.
Short interest ratio
On September 7, Oracle’s short interest as a percentage of its shares outstanding (or short interest ratio) was ~1.3%. Generally, a stock’s short interest ratio that’s greater than 40.0% implies that investors and traders expect a company’s stock price to decline.
Historical stock returns
Year-to-date, Oracle’s stock price has improved ~1.1%. However, it has declined ~1.4% in the last month. The company’s stock price has decreased ~1.2% in the last five days.
