How Nokia Compares to Its Peers
Nokia’s (NOK) expected market-cap-to-revenue ratio is 1.27x for 2018 and 1.24x for 2019.
July 19 2018, Updated 9:02 a.m. ET

Valuation ratios
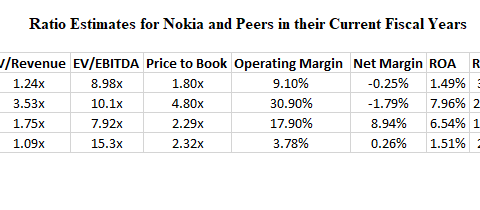
Nokia’s (NOK) expected market-cap-to-revenue ratio is 1.27x for 2018 and 1.24x for 2019. Its EV[1. enterprise value]-to-revenue ratio is expected to be 1.12x in 2018 and 1.10x in 2019, while its EV-to-EBITDA ratio is expected to be 8.98x in 2018 and 7.30x in 2019.
The company’s estimated price-to-book ratio is expected to be 1.80x in 2018 and 1.80x in 2019.
Profitability
Analysts expect Nokia’s operating margin to be 9.1% in 2018 and rise to 11.4% in 2019. Its net margin is expected to be -0.25% in 2018 and 4.28% in 2019. Its return on assets is expected to be 1.49% and 4.4% in 2018 and 2019, respectively, and its return on equity is expected to be 3.89% and 9.40%, respectively.
Balance sheet analysis
Nokia’s ratio of capex to current assets is expected to be 3.27% in 2018 and 2.72% in 2019. Its cash-flow-to-sales ratio is expected to be 5.33% in 2018, and it could rise to 8.35% in 2019.
