Comparing IBM’s Capital Expenditure with Peers’
IBM’s (IBM) capital expenditure has been stable for the last five years due to its huge data center investments.
June 28 2018, Updated 9:03 a.m. ET

Peer comparison
IBM’s (IBM) capital expenditure has been stable for the last five years due to its huge data center investments. The company has more than 60 data centers, and growing demand for cloud computing technology has further boosted its cloud infrastructure investments.
In the last five years, IBM has incurred a total capital expenditure of ~$18.7 billion at an average of ~$3.7 billion per year. Its average annual free cash flow of $13 billion is quite a bit lower, suggesting its excess expenditure has been financed through debt.
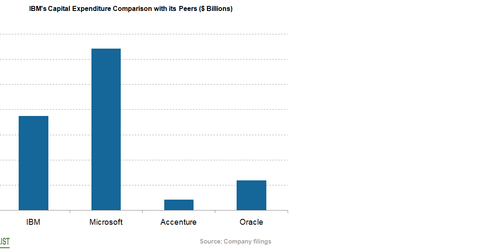
The tech giant has maintained an average capital expenditure-to-sales ratio of 18.8% each year. In fiscal 2017, its capital expenditure fell year-over-year to $3.3 billion from $3.7 billion. In the last five years, Microsoft (MSFT), Accenture (ACN), and Oracle (ORCL) have had a capital expenditure of $32.1 billion, $2.1 billion, and $5.9 billion, respectively, as shown in the chart below.
Factors slowing capital expenditure
To gain market share and enhance its product portfolio, IBM has continued to expand inorganically through acquisitions. In the last five years, the company has spent ~$13.3 billion to acquire more than 34 companies. This huge investment may hinder it from achieving its annual capital expenditure goal.
IBM has maintained a strong capital return policy. In the last five years, it has paid back ~$72.5 billion, maintaining an annual run rate of ~$14.5 billion. Higher capital returns may affect IBM’s capital expenditure.
