What’s Schlumberger’s 7-Day Stock Price Forecast?
On January 19, 2018, Schlumberger’s (SLB) 4Q17 financial results were released.
March 19 2018, Updated 2:50 p.m. ET

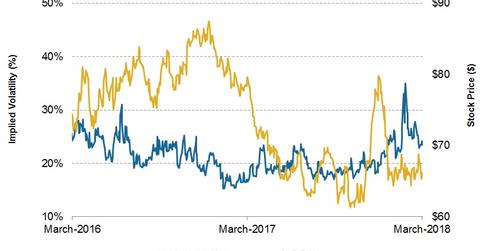
Schlumberger’s implied volatility
On January 19, 2018, Schlumberger’s (SLB) 4Q17 financial results were released. Since then, Schlumberger’s implied volatility increased, from 21% to 23.4% on March 16, 2018, and its stock price fell ~14%. SLB comprises 3.5% of the SPDR S&P Oil & Gas Equipment & Services ETF (XES), which has fallen ~17% since January 19.
Schlumberger’s seven-day stock price forecast
Schlumberger stock will likely close between $68.24 and $63.96 in the next seven days, based on its implied volatility. This forecast considers a normal distribution of stock prices, standard deviation of one, and probability of 68.2%. SLB’s stock price was $66.10 on March 16, 2018. For more about the company, read Schlumberger’s Outlook and Fundamentals in 2018.
Forecasting peers’ stock prices
Peers’ March 16 implied volatility and seven-day stock price forecasts are as follows:
Crude oil’s implied volatility
On March 16, crude oil’s implied volatility was 21.1%, marking an increase from January 19, 2018. Next, we’ll discuss SLB’s correlation with crude oil.
