What Technical Indicators Say about Microsoft Stock?
As of February 26, 2018, Microsoft stock had risen ~2.4% and 0.15% for in trailing-five-day period and the trailing-one-month period, respectively.
March 12 2018, Updated 9:00 a.m. ET

Microsoft’s shareholder returns and stock trends
So far in this series, we’ve discussed Microsoft’s segment-wise performance as well as its overall growth in the last quarter. Microsoft’s better-than-expected fiscal 2Q18 earnings and its increased market share in the cloud space have apparently improved the market sentiment toward the stock.
Below, we’ll take a look at Microsoft’s (MSFT) technical indicators. These help investors make market entry and exit decisions on the stock.
As of February 26, 2018, Microsoft stock had risen ~2.4% and 0.15% for in trailing-five-day period and the trailing-one-month period, respectively. MSFT stock has risen ~10% and ~46% YTD (year-to-date) in 2018 and in the trailing-12-month period, respectively.
By comparison, IBM (IBM) SAP (SAP), and Oracle (ORCL) have generated returns of -13.7%, 11.5%, and 17.5%, respectively, in the trailing-12-month period.
Microsoft’s MACD
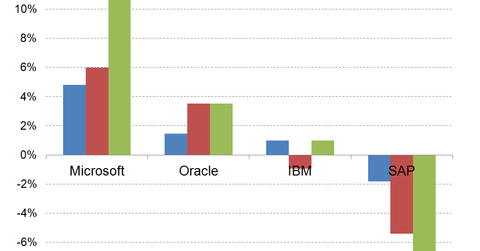
On February 26, 2018, Microsoft stock closed at $95.40. The stock was trading 5% above its 20-day moving average of $91.00, 6% above its 50-day moving average of $90.00, and 11% above its 100-day moving average of $86.00.
A company’s MACD (moving average convergence divergence) is the difference between its short-term and long-term moving averages. Microsoft’s 14-day MACD of 1.12 shows a major upward trading trend, as the figure is positive.
