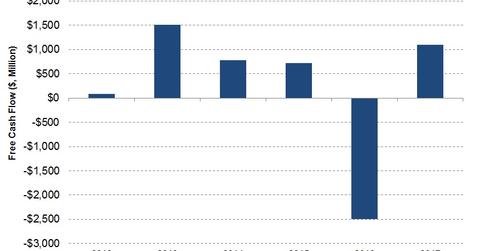
How Did Halliburton Turn Its Free Cash Flow Positive in 2017?
Halliburton’s (HAL) CFO (cash flow from operating activities) in 2017 was a significant improvement over 2016.
Nov. 20 2020, Updated 2:27 p.m. ET

Halliburton’s operating cash flows
Halliburton’s (HAL) CFO (cash flow from operating activities) in 2017 was a significant improvement over 2016. HAL’s CFO was $2.5 billion in 2017 compared to -$1.7 billion a year ago. Read more about HAL in Market Realist’s Halliburton: A Post-2017 Analysis.
Halliburton’s free cash flow
From 2016 to 2017, HAL’s capex (capital expenditure) rose 72%. However, the turnaround in its CFO more than offset the sharp rise in its capex. This, in effect, meant Halliburton’s FCF (free cash flow) turned positive in 2017. In 2017, HAL’s FCF was $1.1 billion compared to -$2.5 billion a year earlier. Halliburton’s FCF has been positive in five out of the past six years. Halliburton makes up 10.8% of the iShares US Oil Equipment & Services ETF (IEZ). IEZ tracks an index composed of US equities in the oil equipment and services sector. Since March 21, 2017, IEZ has fallen 20% compared to HAL’s -10.1% return.
In comparison, Oceaneering International (OII), HAL’s lower-market-cap OFS industry peer, generated $42.8 million in FCF in 2017. This was ~81% lower than its FCF in 2016.
Halliburton’s capex and acquisitions
The majority of HAL’s 2017 capex was spent on its Production Enhancement, Sperry Drilling, Production Solutions, Wireline and Perforating, and Baroid product service lines. In 2017, Halliburton acquired Summit ESP, Ingrain, and Optimization Petroleum Technology for ~$630 million. In 2018, HAL plans to increase its capex by 25% over 2017.
Next, we’ll discuss National Oilwell Varco’s cash flow and capex.
