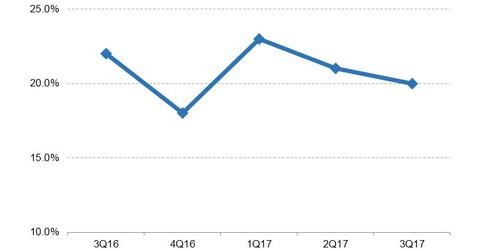
Examining Facebook’s Cost Structure
A scrutiny of Facebook’s (FB) cost structure reveals that the company’s costs and expenses rose faster in 3Q17 than in the prior quarter and year-ago quarter.
Nov. 24 2017, Updated 10:30 a.m. ET

Facebook’s expenses increased 34%
A scrutiny of Facebook’s (FB) cost structure reveals that the company’s costs and expenses rose faster in 3Q17 than in the prior quarter and year-ago quarter.
Facebook’s total costs and expenses were $5.2 billion in 3Q17, an increase of 34% YoY (year-over-year) compared with a 33% YoY increase in 2Q17 and a 28% YoY increase in 3Q16.
Facebook’s expenses rose the most compared to several of its industry peers in 3Q17. That quarter, Alphabet’s (GOOGL) expenses rose 19.8% YoY, Twitter’s (TWTR) rose 16% YoY, Yelp’s (YELP) rose 17% YoY, and Snap’s (SNAP) rose 158.4% YoY.
Product development and marketing budgets drove expenses
The increase in Facebook’s costs in the latest quarter was due to higher expenses tied to product development and sales and marketing. Facebook’s R&D (research and development) expenses were $2.1 billion in 3Q17 compared with $1.5 billion in the year-ago quarter.
R&D expenses were partly driven by investments in building new technologies such as artificial intelligence (or AI) tools to combat abuse and problematic content on Facebook’s platforms. Facebook said it has opened a new AI research lab in Montreal, Canada, and is building another one in Paris, France.
Facebook’s sales and marketing expenses rose to $1.2 billion in 3Q17 compared with $926 million in 3Q16.
Expenses fell as a percentage of revenue
Despite the increase in the actual size of R&D and marketing expenses, these costs declined as a percentage of revenue. For example, R&D expenses consumed 20% of Facebook’s revenue in 3Q17 compared with 22% in 3Q16. Marketing expenses consumed 11% of revenue in 3Q17 compared with 13% in 3Q16.
