A Brief New Look at the Technical Indicators of Mining Stocks
The Physical Silver Shares (SIVR) and Physical Swiss Gold Shares (SGOL) witnessed rises on Friday, October 16, climbing 0.98% and 0.81%, respectively.
Oct. 18 2017, Updated 7:43 a.m. ET

Technical readings
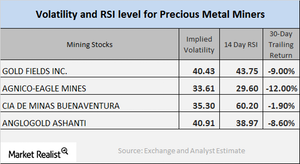
When investors consider parking their money in mining shares, the key indicators they watch are RSI (relative strength index) levels and call implied volatility. The volatility of mining stocks can often be higher than that of the metals themselves.
Call implied volatility is used to measure the fluctuations in the price of an asset, given the variations in the price of its call option. RSI indicates whether a share is overpriced or underpriced—above 70 suggesting overbought and below 30 suggesting oversold.
Notably, the Physical Silver Shares (SIVR) and Physical Swiss Gold Shares (SGOL) witnessed rises on Friday, October 16, climbing 0.98% and 0.81%, respectively.
Call implied volatility and RSI of key mining stocks
As of October 16, 2017, Agnico-Eagle Mines (AEM), Franco-Nevada (FNV), Yamana Gold (AUY), and AngloGold Ashanti (AU) had implied volatility readings of 33.6%, 25.5%, 48.4%, and 40.9%, respectively.
The above mining shares’ RSI levels have recuperated recently. AEM, FNV, AUY, and AU now have RSI scores of 42.7, 57.1, 32.7, and 42.4, respectively. These RSI numbers indicate that the prices of the mining stocks have rebounded as of mid-October.
