ExxonMobil’s Journey as a Dividend Aristocrat
ExxonMobil’s (XOM) story is similar to Chevron’s. The company’s sales and other operating revenue for 2016 fell 16.0%.
Aug. 16 2017, Published 9:36 a.m. ET

ExxonMobil: Basic materials sector, major integrated oil and gas industry
ExxonMobil’s (XOM) story is similar to Chevron’s. The company’s sales and other operating revenue for 2016 fell 16.0%, mainly due to a decline in the upstream segment, followed by the downstream segment. The chemical segment recorded growth due to strong global demand for petrochemicals. The company recorded a marked fall in EPS (earnings per share). It has been unable to generate enough free cash flow in the last two years to honor its dividend obligations. Its financial leverage remained stable, and its debt-to-equity ratio remained fairly low.
As you can see in the graph below, the company’s trajectory of dividend yield is very similar to Chevron’s. (Note that the asterisk in the graph denotes an approximation in calculating the dividend.)
Sales for the first half of the year
The company’s sales and other operating revenue for the first half of 2017 rose 18.0%, driven by all its segments. EPS rose phenomenally despite higher costs.
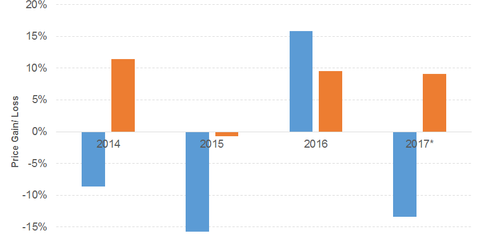
We can see in the above graph that ExxonMobil stock has performed worse than Chevron (CVX) stock in spite of being relatively more diversified. (Note that the asterisk in the graph denotes a price gain or loss to date.)
XOM stock has fallen 14.0% on a YTD (year-to-date) basis, almost double Chevron’s.
XOM’s acquisition of InterOil Corporation and the agreement to acquire certain oil and gas properties in the Permian Basin and additional properties and related assets are in the cards.
ExxonMobil’s PE ratio of 41.7x compares to a sector average of 32.7x. The company’s dividend yield of 3.9% compares to a sector average of 7.3%.
The Schwab US Dividend Equity ETF (SCHD) has a dividend yield of 2.8% at a PE ratio of 20.3x. It has the highest exposure to consumer goods. The PowerShares S&P 500 High Dividend ETF (SPHD) has a dividend yield of 3.7% at a PE ratio of 17.3x. It has the highest exposure to financials followed by utilities and consumer goods.
