Volatility for Precious Metal Miners: Movement Going Forward
The ETFS Physical Swiss Gold (SGOL) and the ETFS Physical Silver (SIVR) have risen 8.5% and 4.1%, respectively, on a year-to-date basis as of May 18, 2017.
May 24 2017, Published 4:28 p.m. ET

Mining stock technicals
There are a few technical indicators we have to consider when analyzing the performance of mining stocks. The direction that these technical numbers follow can be useful in determining potential price changes in an asset. In this part of the series, we’ll look at the 14-day RSI (relative strength index) scores and implied volatilities.
The ETFS Physical Swiss Gold (SGOL) and the ETFS Physical Silver (SIVR) have risen 8.5% and 4.1%, respectively, on a year-to-date basis as of May 18, 2017. Most of the time, the volatility of mining funds is higher than the volatilities of metal-based funds.
The fall during the past few months negatively affected mining stocks and funds. However, the past week was good, as most miners saw a revival. Investors have their eyes set on the potential impact of a Fed rate hike on precious metals and their miners. It may also substantially change the volatility for precious metals.
Implied volatility
Call implied volatility takes into account the changes in an asset’s price due to variations in the price of its call option. During times of global and economic turbulence, volatility typically rises.
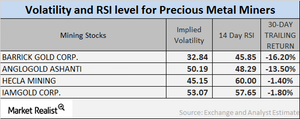
On May 18, 2017, the implied volatilities of Barrick Gold (ABX), AngloGold Ashanti (AU), Hecla Mining (HL), and Iamgold (IAG) were 32.8%, 50.2%, 45.2%, and 53.1%, respectively. Mining companies’ volatilities are often higher than precious metals’ volatilities.
RSI scores
A 14-day RSI score above 70 suggests that a stock may fall, whereas a score below 30 suggests that a stock may rise. The RSI levels of the four mining giants mentioned above have all increased due to their higher stock prices.
Barrick, AngloGold, Hecla, and Iamgold have RSI scores of 45.9, 48.3, 60.0, and 57.7, respectively. These RSI scores have recovered along with the respective companies’ stock prices.
