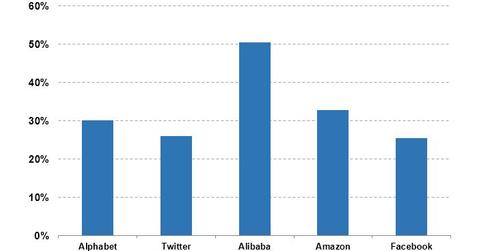
Chart in Focus: Alphabet’s Returns and Stock Trends
On May 12, 2017, Alphabet (GOOGL) generated investor returns of 30.1% on a trailing 12-month basis.
Dec. 4 2020, Updated 10:52 a.m. ET

Shareholder returns and stock trends
On May 12, 2017, Alphabet (GOOGL) generated investor returns of 30.1% on a trailing 12-month basis. Among its peers, Twitter (TWTR), Alibaba (BABA), Amazon (AMZN), and Facebook (FB) generated investor returns of 26.1%, 50.6%, 32.9%, and 25.5%, respectively.
Moving averages
On May 12, 2017, Alphabet closed the trading day at $955.14. Here’s how the stock fared in terms of its moving averages:
- 9% above its 100-day moving average of $831.00
- 7% above its 50-day moving average of $855.00
- 7% above its 20-day moving average of $887.00
Over the last one-month period, Alphabet stock yielded a return of 13.0%, while Twitter, Alibaba, Amazon, and Facebook posted returns of 28.5%, 8.8%, 5.0%, and 7.2%, respectively.
On the other hand, the trailing one-year returns for Alphabet, Twitter, Alibaba, Amazon, and Facebook were 30.1%, 26.0%, 50.6%, 32.9%, and 25.5%, respectively.
Price-to-earnings estimate
The price-to-earnings (or PE) ratio on Alphabet’s earnings estimate is 27.5x. The PE ratios for Twitter, Alibaba, Amazon, and Facebook are 55.6x, 34.9x, 141.6x, and ~31.1x respectively.
How do analysts view Twitter?
Alphabet (GOOGL) was given a “buy” rating by ten of the 12 analysts covering it. Two analysts recommended a “hold” while none recommended a “sell.” Analysts’ stock price target for the company is $999, and the median price target for the company is $1,035.
