Analyzing Weatherford International’s Growth Drivers in 4Q16
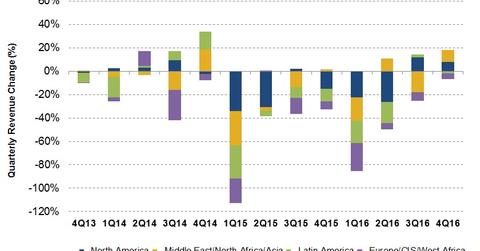
Revenues from Weatherford International’s (WFT) Europe/Sub Saharan Africa/Russia region fell the most with a 36.5% fall from 4Q15 to 4Q16.
April 19 2017, Updated 12:35 p.m. ET

Weatherford International’s growth by geography
Weatherford International’s 2016 earnings
In fiscal 2016, Weatherford International’s reported net loss deteriorated to ~$3.4 billion in 2016 compared to a ~$2.0 billion net loss in 2015. In 2016, WFT’s bottom line was negatively affected by ~$1.0 billion in impairment charges and asset write-down (pre-tax) and $280 million pre-tax asset severance and restructuring-related charges.
Comparison with peers
In comparison, Halliburton’s (HAL) net loss in 2016 was $5.7 billion, while National Oilwell Varco’s (NOV) net loss was $2.4 billion. The Dow Jones Industrial Average (DJIA-INDEX) rose 14% in the past one year versus a 24% fall in WFT’s stock price. The energy sector makes up 6.3% of the DJIA-INDEX.
Positive factors affecting WFT’s 4Q16 performance
- The North America rig count was nearly 20% higher in 4Q16 compared to 3Q16, which positively affected well construction, drilling services, and completion product lines.
- The company saw increased product deliveries in its completions and artificial lift business in the Middle East/North Africa/Asia Pacific region.
- The company saw increased service activity in Algeria and the Gulf countries.
Negative factors affecting WFT’s 4Q16 performance
- weaker activity in Venezuela
- lower offshore activity in Mexico and continued weakness in offshore operations in Brazil
- offshore West Africa activity reductions
Next, we’ll discuss WFT’s plans to restructure costs and improve earnings.
