Looking Back: What Drove Target’s Top Line in 2Q16?
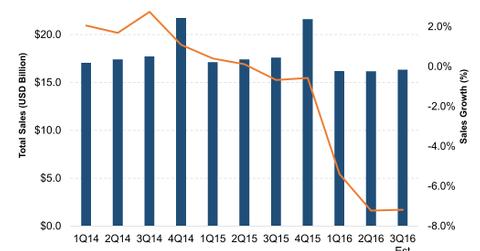
In 2Q16, mass merchandiser Target (TGT) reported a 7.2% decline in its top line to $16.2 billion. Target’s 2Q16 revenues were affected by lower traffic and higher variability in sales patterns.
Nov. 14 2016, Updated 10:05 a.m. ET

What drove Target’s top line in 2Q16?
In 2Q16, mass merchandiser Target (TGT) reported a 7.2% decline in its top line to $16.2 billion. The decline resulted from the removal of Pharmacy and Clinic revenues from the company’s results and a 1.1% fall in the company’s same-store sales during the quarter.
In December 2015, Target closed the sale of its Pharmacies and Clinics business to CVS Health (CVS) for $1.9 billion.
Target’s 2Q16 revenues were affected by lower traffic and higher variability in sales patterns. However, events such as the Fourth of July, Memorial Day, and the back-to-school season boosted the company’s top line.
Comparable digital channel sales continued to remain strong and grew more than 16% during the quarter, contributing 0.5% to comparable sales growth. In comparison, Walmart’s (WMT) e-commerce sales increased 11.8% on a constant-currency basis in its last reported quarter.
Target has seen strong digital conversion over the last few years. Its digital conversion has tripled across all platforms since 2013, particularly in the mobile space.
Comparing Target’s performance to peers
Target’s top line has grown at a CAGR[1. compound annual growth rate] of 1.8% in the last five years. Walmart (WMT) and Costco Wholesale (COST) have grown at a faster pace during the same period. Walmart’s revenue has grown at a CAGR of 2.7% to reach $482.1 billion in fiscal 2016. Costco has reported a compound annual top-line growth of 8.3% to $116.2 billion in its last fiscal year.
Target, Walmart, and Costco together make up 3.6% of the portfolio holdings of the SPDR S&P Retail ETF (XRT). XRT has exposure to about 100 stocks in the retail sector.
Read the next section to learn about Target’s margins and profitability in 2Q16.
