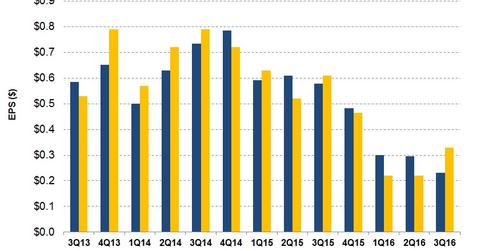
Why Did FMC Technologies’ 3Q16 Earnings Beat Estimates?
The 3Q16 adjusted net EPS (earnings per share) for FMC Technologies is $0.33. This exceeded sell-side analysts’ EPS estimates significantly by 43.0%.
Oct. 20 2016, Published 1:22 p.m. ET

FMC Technologies’ 3Q16 revenues
FMC Technologies’ 3Q16 earnings
The 3Q16 adjusted net EPS (earnings per share) for FMC Technologies is $0.33. This exceeded sell-side analysts’ EPS estimates significantly by 43.0%. Resilient performance in its Surface Technologies segment and higher operating income in its Energy Infrastructure segment resulted in earnings beating analysts’ estimates.
Compared to 3Q15 when FTI’s adjusted earnings were $0.61, earnings fell 46.0% in 3Q16. In the past 13 quarters, adjusted earnings nearly matched analysts’ estimated earnings. By comparison, analysts expect Carbo Ceramics’ (CRR) 3Q16 adjusted net loss to improve to $0.73 compared to an adjusted net loss of $0.92 in 2Q16. FMC Technologies makes up 0.08% of the SPDR S&P 500 Value ETF (SPYV). Energy makes up 13.1% of SPYV.
What affected FMC Technologies’ reported earnings in 3Q16?
In 3Q16, FTI’s reported net income was $32.3 million, which was ~61.0% lower than $82.0 million in 3Q15. Year-over-year, FTI’s fall in income reflects a lower rig count and lower exploration and drilling spend by upstream companies, driven by lower energy prices.
Its 3Q16 net income also fell due to restructuring, other severance charges, and business combination transaction costs related to the proposed combination with Technip. Partially offsetting these charges was a $9.5 million tax benefit due to lower profits from North America and other tax benefits. Read Market Realist’s FMC Technologies and Technip to Form Energy Services Giant to know more about the proposed merger.
The company’s 3Q16 reported net income was a huge improvement over 2Q16 when it reported a measly $2.2 million in net income. Sharply lower 2Q16 net income was driven by much larger restructuring and severance charges and business combination transaction costs compared to 3Q16.
Next, we’ll take a look at FTI’s growth drivers.
