A Look at Time Warner’s Key Metrics
In fiscal 1Q16, Time Warner bought back $700 million worth of shares. Including dividends, it has returned around $1.3 billion to its shareholders year-to-date.
Dec. 4 2020, Updated 10:53 a.m. ET

Leverage ratio
Last month, Time Warner (TWX) announced the pricing of its $800 million debt offering. The company stated that it’s offering 2.95% senior notes that will be due in 2026 and will be priced at 98.7% of their face value.
The company had a leverage ratio of 2.8x as of March 31, 2016, which was slightly higher than its target leverage ratio of 2.75x. However, it stated in its fiscal 1Q16 earnings call that it expects to achieve the target leverage ratio by the end of 2016. Time Warner had a net debt of $22 billion at the end of fiscal 1Q16.
Time Warner is also expecting its adjusted EPS (earnings per share) to be $5.30–$5.40 in 2016.
[marketrealist-chart id=1382110]
Five-year average dividend yield
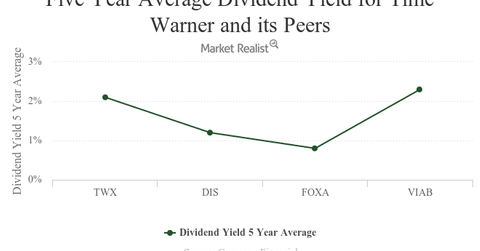
As you can see in the above graph, Time Warner has a five-year average dividend yield of 2.1%. Viacom (VIAB) has a higher five-year average dividend yield of 2.3%. The Walt Disney Company (DIS) and 21st Century Fox (FOXA) have five-year average dividend yields of 1.2% and 0.8%, respectively.
A dividend yield is a measure of a company’s annual dividend per share relative to its price per share. It indicates how much cash an investor is getting for every dollar invested in the company’s equity.
In fiscal 1Q16, Time Warner bought back $700 million worth of shares. Including dividends, it has returned around $1.3 billion to its shareholders year-to-date.
Free cash flow
At the end of fiscal 1Q16, Time Warner had a free cash flow of $714 million. That compares to around $1 billion at the end of fiscal 1Q15. The decrease in cash flow was due to a rise in working capital. However, the company expects a very strong free cash flow in 2016.
Time Warner makes up 0.32% of the SPDR S&P 500 ETF (SPY). SPY has an exposure of 2.7% to the communications services sector.
