Sears Holdings’ Revenue Fell, Income Rose in Fiscal 3Q15
Sears has a market cap of $2.0 billion. Its YTD price movement both rose and fell in fiscal 2015. After it released its fiscal 3Q15 report, SHLD fell by 6.9%.
Nov. 20 2020, Updated 11:40 a.m. ET

Price movement of Sears
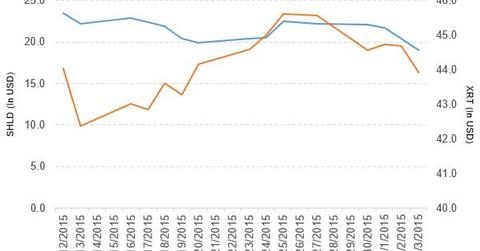
Sears (SHLD) has a market cap of $2.0 billion. Its YTD (year-to-date) price movement was a mix of rises and falls in fiscal 2015. After the company released its fiscal 3Q15 earnings report, SHLD fell by 6.9% to close at $19.0 per share as of December 3, 2015. The price movement on a weekly, monthly, and YTD basis is -15.4%, -20.7%, and -42.4%, respectively.
The stock is trading under all the moving day averages. Currently, SHLD is trading 15.4% below its 20-day moving average, 19.3% below its 50-day moving average, and 38.1% below its 200-day moving average.
The SPDR S&P Retail ETF (XRT) invests 0.84% of its holdings in Sears Holdings. The ETF tracks a broad-based, equal-weighted index of stocks in the US retail industry. The YTD price movement of XRT is -6.1% as of December 2, 2015.
The competitors of Sears (SHLD) and their market caps are:
Performance of Sears in fiscal 3Q15
Sears reported fiscal 3Q15 revenue of $5,750.0 million, a fall of 20.2% when compared to its revenue of $7,207.0 million in fiscal 3Q14. Revenue of Kmart and Sears domestic segments fell by 17.0% and 9.9%, respectively, in fiscal 3Q15 as compared to their revenue in 3Q14. The company’s cost of sales as a percentage of revenue rose by 1.3%, and gross profit margin fell by 1.4% in fiscal 3Q15 as compared to the prior year period.
Sears Holdings’ net income and EPS (earnings per share) rose to -$454.0 million and -$4.26, respectively, in fiscal 3Q15, as compared to net income and EPS of -$548.0 million and -$5.15, respectively, in fiscal 3Q14. Its adjusted EBITDA[1. Earnings before interest, tax, depreciation, and amortization] fell to -$332.0 million, a fall of 7.4% as compared to the prior year period.
Meanwhile, cash and cash equivalents and merchandise inventories fell by 9.8% and 4.0%, respectively, in fiscal 3Q15, as compared to prior year period. The company’s current ratio rose to 1.1 in fiscal 3Q15, as compared to the current ratio of 0.90 in fiscal 3Q14.
According to Edward S. Lampert, Sears Holdings’ chairperson and CEO, “We remain focused on restoring Sears Holdings to profitability by concentrating on our best stores, rewarding our best members and pursuing our best categories through innovative solutions to product and service offerings. Through deliberate strategic actions, notably with respect to our promotional design and marketing spend, we have made meaningful progress in our transformation and reported a fifth consecutive quarter of improved year-over-year results.”
He went on to add, “As we head into the fourth quarter, we have intensified our focus on our product offerings and promotions in order to enhance member engagement and provide our members with the best experience possible throughout the holiday shopping season.”
About Sears
Sears is an integrated retailer. It operates through its subsidiaries, including Sears, Kmart, and Roebuck and Co.
Visit Market Realist’s Department Stores page for an in-depth fundamental analysis of the sector.
