Kroger’s Fiscal 2015 Revenue at an All-Time High
Kroger’s (KR) revenue reached an all-time high of $108 billion in fiscal 2015, which ended January 31, 2015, up by 10.3% from fiscal 2014.
Nov. 9 2015, Updated 5:05 p.m. ET

Sales growth
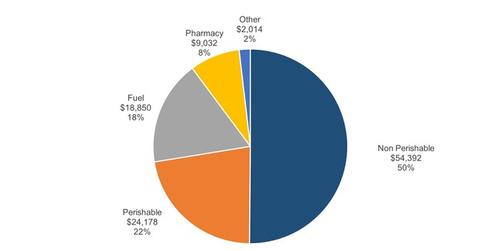
Kroger’s (KR) revenue reached an all-time high of $108 billion in fiscal 2015, which ended January 31, 2015, up by 10.3% from fiscal 2014. This increase was primarily due to the Harris Teeter acquisition and an increase in same-store sales. The main reasons for an increase in identical supermarket sales (excluding fuel) were:
- an increase in the customer base
- an increase in visits per household
- product cost inflation
Total fuel sales registered a decline of 0.6% due to a 6.8% decrease in the average retail fuel price, which was partially offset by a 6.6% increase in fuel gallons sold.
The perishable segment, which accounts for 22% of total sales, registered the largest growth, with 17.2%. This segment was followed by the Pharmacy segment (11.9%) and the non-perishable segment (10.5%). Fuel sales dropped by 0.6% on lower gas prices. Natural and organic products saw double-digit growth across multiple segments.
Margin growth
Kroger gross margin grew from 20.6% in fiscal 2014 to 21.16% in fiscal 2015. The margin expansion was primarily due to the Harris Teeter merger (which had higher margins as compared to Kroger), higher fuel gross margin rate, and a reduction in warehouse and transportation costs as a percentage of sales. The company’s operating profit stood at $3.1 billion in fiscal 2015, as compared to $2.7 billion in fiscal 2014, up 12 basis points.
Net earnings for fiscal 2015 stood at $1.73 billion, or $3.44 per diluted share. Kroger’s adjusted net earnings for the year totaled $1.77 billion, or $3.52 per diluted share.
Kroger outperformed most of its peers during fiscal 2015. Its sales grew by 10.3% as compared to 9.8% of Whole Foods Market Inc. (WFM), 3.8% of SuperValu Inc. (SVU), and 1.9% of Walmart Stores Inc. (WMT).
Kroger’s EBITDA growth was even more impressive. The company’s EBITDA grew by 14% in comparison to a 5.7% growth for Whole Foods (WFM), 1.6% for Walmart (WMT), and -2.2% for SuperValu (SVU).
The fiscal years ended at different points for these companies:
- Whole Foods Market: September 28, 2014
- Kroger: January 31, 2015
- Walmart: January 31, 2015
- Supervalu: February 28, 2015
Kroger (KR), along with Whole Foods (WFM), SuperValu (SVU), and Walmart (WMT), are included in the portfolio of the SPDR S&P Retail ETF (XRT). Together, they constitute ~4% of the XRT’s holdings.
