The Inverted Hammer And Shooting Star Candlestick Pattern
A Shooting Star candlestick pattern has one candle. It looks like a shooting star. The open, close, and low are near the low of the candlestick.
Nov. 27 2019, Updated 7:21 p.m. ET

Inverted Hammer candlestick pattern
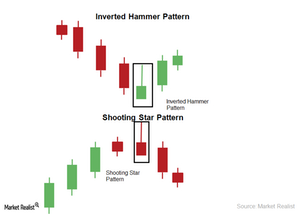
In technical analysis, the Inverted Hammer candlestick pattern is the reverse of the Hammer pattern. The pattern has one candle. The open, close, and low are near the low of the pattern.
The above chart shows the Inverted Hammer and Shooting Star Candlestick pattern.
An Inverted Hammer pattern forms when the buyers push the stock price higher against the sellers. However, the stock retraces and closes near the open. The pattern reflects buying interest for technical, psychological, or fundamental reasons. When the pattern forms in a downtrend, it suggests a possible market bottom or change in trend. So, it’s one of the reversal patterns.
Shooting Star candlestick pattern
A Shooting Star candlestick pattern has one candle. It looks like a shooting star. The open, close, and low are near the low of the candlestick.
The Shooting Star candlestick pattern forms when buyers push the price higher against the sellers. However, the stock falls and closes near the low. The pattern reflects selling interest for psychological or fundamental reasons. When the pattern forms in an uptrend, it suggests a possible market top or change in trend. So, it’s a reversal candlestick pattern.
These patterns are used for trend identification. The Inverted Hammer pattern is used as an entry point. The Shooting Star pattern is used as an exit point. It’s advisable to use combination of patterns and indicators to determine your trading strategy.
