High yield bond ETFs’ performance compared to cyclical industry ETFs
During economic uncertainty, investors want steady, guaranteed returns from the Treasury instead of quick returns from price movements in equity ETFs.
Feb. 24 2014, Updated 2:59 p.m. ET

The ETFs described here are the ones used for the comparison. We have considered the equity ETFs, XLY and XRT. The Consumer Discretionary Select Sector SPDR (XLY) follows the Consumer Discretionary Select Sector Index that includes companies from the following industries: retail; media; hotels, restaurants, and leisure; household durables; textiles, apparel, and luxury goods; automobiles, auto components, and distributors. XRT, the SPDR S&P Retail ETF follows S&P Retail Select Industry Index, which represents the retail sub-industry portion of the S&P TMI. The S&P TMI tracks all the U.S. common stocks listed on the major exchanges.
For a counter cyclical/defensive equity ETF, we have considered DEF. It tracks the Defensive Equity Index that is designed to actively represent a group of securities that reflect occurrences such as low relative valuations, conservative accounting, dividend payments, and a history of out-performance during a bear market.
Under high yield bond ETFs, we have considered HYG and JNK. HYG is iShares iBoxx $ High Yield Corporate Bond ETF and follows iShares’ rules-based index consisting of liquid U.S. dollar-denominated, high yield corporate bonds for sale in the U.S. JNK is Barclays Capital High Yield Bond ETF and follows The Barclays Capital High Yield Very Liquid Index, which includes publicly issued U.S. dollar denominated, non-investment grade, fixed-rate, taxable corporate bonds that have a remaining maturity of at least one year.
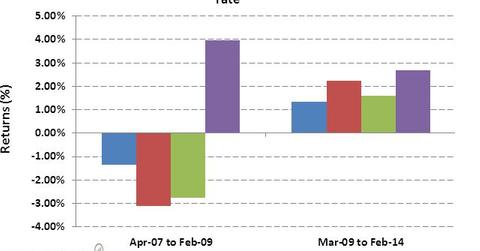
In order to understand the relative performance of equity and bond ETFs vis-à-vis SPY, we have divided our horizon of 2007–2014 into two periods. The first period, April 2007–February 2009, covers the time when the financial crisis was at its high and the economic growth suffered the most. Our next stage, March 2009–January 2014, is when the economic growth started to improve, but there were still uncertainties. We compare these two situations to get an idea of how the ETFs would perform if similar situations arise in the future.
It’s noticeable from the graph above that during 2007–2009, all the ETFs posted negative returns; but an investor who invested in high yield bonds would lose 1.3% of the investment value while an investor in cyclical equity ETFs would see around 3.1% depletion in the investment. High yield bond ETFs performed even better than counter-cyclical DEF in absolute return terms. As the economy and the Consumer Discretionary Index improved during 2009–2014 period, returns from cyclical equity ETFs surged. DEF, the counter-cyclical ETF, produced returns similar to SPY while bond ETFs have followed closely. So, the returns structure validates that cyclical industry outperformed general economic growth when the economy was expanding.
We also notice that during 2007–2009, the risk-free Treasury managed to post an average yield of 4%. The Treasury rate came down to an average of 2.7% during 2009–2014. This implies that the demand for risk-free securities has gone up after the crisis. In times of economic uncertainty, investors look for a steady, guaranteed returns from the Treasury instead of quick returns from price movements in equity ETFs. The higher demand was fueled by uncertainty among investors and the Fed bond-buying program, quantitative easing. The rate has gone marginally higher at 2.8% since beginning of January 2014. This has coincided with the tapering of Fed bond-buying rate.
