A Look at Regency Centers’ Dividend Yield
Revenue and earnings Retail REIT Regency Centers (REG) saw its revenue grow 8% in 2016, compared with 6% in 2015. The growth was driven by minimum rent, recoveries from tenants, and other income. Its operating expenses rose 10% in 2016, and 3% in 2015. Its interest expenses fell 12% in 2016 and 6% in 2015. Its […]
Sept. 18 2017, Published 11:16 a.m. ET

Revenue and earnings
Retail REIT Regency Centers (REG) saw its revenue grow 8% in 2016, compared with 6% in 2015. The growth was driven by minimum rent, recoveries from tenants, and other income.
Its operating expenses rose 10% in 2016, and 3% in 2015. Its interest expenses fell 12% in 2016 and 6% in 2015. Its other expenses (including interest expenses) rose 33% and 34% in 2015 and 2016, respectively. As a result, its income from operations rose 2% in 2016 after falling 13% in 2015. The company’s gains on asset dispositions rose between 2015 and 2016. These gains and losses translated into 4% EPS (earnings per share) growth in 2016. Its EPS had fallen 24% in 2015. The company’s FFO (funds from operations) were flat in 2016 after growing slightly in 2015.
Revenue and EPS in 1H17
In 1H17, Regency Centers’ revenue rose 51%, driven by every component. Its operating expenses rose 95%, and its other expenses rose 47%, mainly driven by interest expenses and debt extinguishment. Its income from operations fell 69%, leading to its EPS falling 88%. The company’s FFO grew 8%.
Dividend
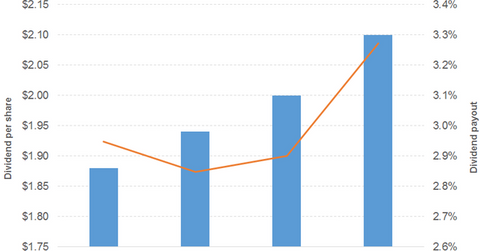
The company has consistently increased its dividend. Its dividend payout rose phenomenally between 1H16 and 1H17, after remaining consistent between 2014 and 2016.
Stock price
Regency Centers stock has been beaten by both the PowerShares Dynamic Retail ETF (PMR) and the PowerShares KBW High Dividend Yield Financial Portfolio ETF (KBWD). Its dividend increase and price slump in mid-2015 enhanced its dividend yield.
The FlexShares Quality Dividend Index ETF (QDF) offers a dividend yield of 3%, at a PE (price-to-earnings) ratio of 22.2x. It has an 11%, 10%, 9%, and 9% exposure to the financial, consumer non-cyclical, consumer cyclical, and real estate spaces, respectively. The Global X SuperDividend US ETF (DIV) offers a 6.2% dividend yield, at a PE ratio of 15x. It has a 24%, 13%, 12%, and 2% exposure to the real estate, consumer non-cyclical, consumer cyclical, and financial spaces, respectively.
