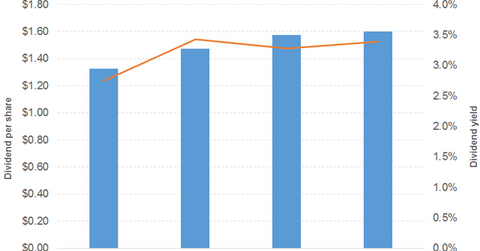
Comparing MetLife’s Dividend Yield
Revenue and earnings MetLife (MET), the holding corporation for the Metropolitan Life Insurance Company, saw its revenue fall 9% in 2016 and 5% in 2015. The fall was driven by universal life and investment-type product policy fees, net investment income, and other revenue. Expenses rose 2% in 2016 after falling 3% in 2015. Income from continuing operations, […]
Sept. 18 2017, Published 11:21 a.m. ET

Revenue and earnings
MetLife (MET), the holding corporation for the Metropolitan Life Insurance Company, saw its revenue fall 9% in 2016 and 5% in 2015. The fall was driven by universal life and investment-type product policy fees, net investment income, and other revenue.
Expenses rose 2% in 2016 after falling 3% in 2015. Income from continuing operations, as a result, turned negative. Its interest expenses rose 12% in 2016 after falling 19% in 2015. As a result, its EPS (earnings per share) fell 86%, after falling 16% in 2015.
Revenue and EPS in 1H17
In 1H17, MetLife’s revenue growth was flat, driven by premiums and net investment income. Its expenses rose 3%, with its interest expenses rising 16%. As a result, its EPS fell 25%.
Dividend
The company has noted a continuous increase in its dividend. Its dividend payout rose phenomenally between 2015 and 2016, and slightly between 1H16 and 1H17.
Stock price
MetLife stock has been beaten by both the SPDR S&P Insurance ETF (KIE) and the Fidelity MSCI Financials Index ETF (FNCL) most of the time over the last three years.
The O’Shares FTSE US Quality Dividend ETF (OUSA) offers a 2.1% dividend yield, at a PE (price-to-earnings) ratio of 20.2x. It has a 3% exposure to financials. The WisdomTree US High Dividend ETF (DHS) offers a 3.2% dividend yield, at a PE ratio of 21x. It has a 5% exposure to financials.
