Tech Adoption Rates Have Reached Dizzying Heights
Technology (XLK) is advancing by leaps and bounds. The diffusion and adoption rates for new technologies have risen over the years as the population has become more tech-savvy.
Sept. 1 2020, Updated 9:25 a.m. ET

These three charts help explain why.
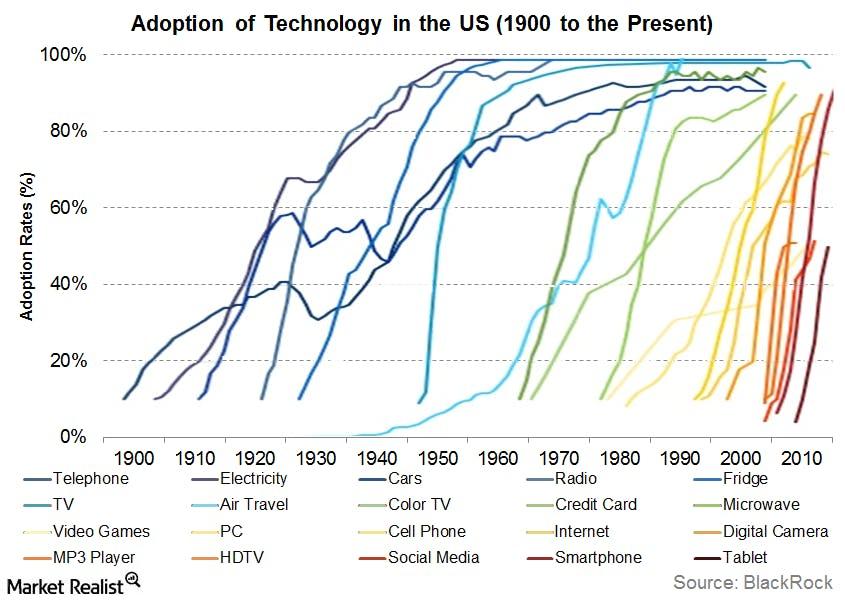
1. Adoption of Technology in the U.S., 1900 to present

As the chart above shows, people in the U.S. today are adopting new technologies, including tablets and smartphones, at the swiftest pace we’ve seen since the advent of the television. However, while television arguably detracted from U.S. productivity, today’s advances in technology are generally geared toward greater efficiency at lower costs. Indeed, when you take into account technology’s downward influence on price, U.S. consumption and productivity figures look much better than headline numbers would suggest.

Market Realist – Adoption rates have risen fast.
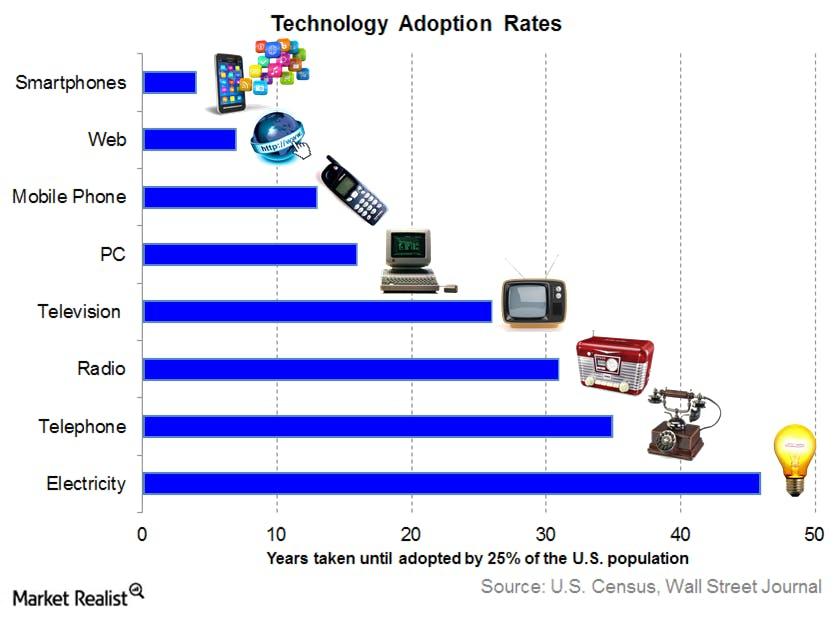
Technology (XLK) is advancing by leaps and bounds. The diffusion and adoption rates for new technologies have risen over the years as the population has become more tech-savvy. The above graph shows the number of years it took technologies like electricity, television, and the Internet to be adopted by at least 25% of the US population.
Telephones took 35 years to spread through the US markets (SPY). The diffusion of the Internet and smartphones occurred at a much faster pace of seven and four years, respectively. According to statistics compiled by A.C. Nielsen, smartphones grew their penetration from 5% to 40% in a span of only four years. This diffusion rose despite the 2008 recession caused by the US financial crisis (XLF)(IYF).

The benefits of technology and innovation are varied and many. At its very core, innovation helps generate value for customers and, in turn, stakeholders. It not only offers a competitive advantage but also places the business in a better position to adapt to dynamic changes in the global business environment (ACWI). Innovation may drive company growth and, in turn, economic growth by helping businesses minimize risks and magnify opportunities.
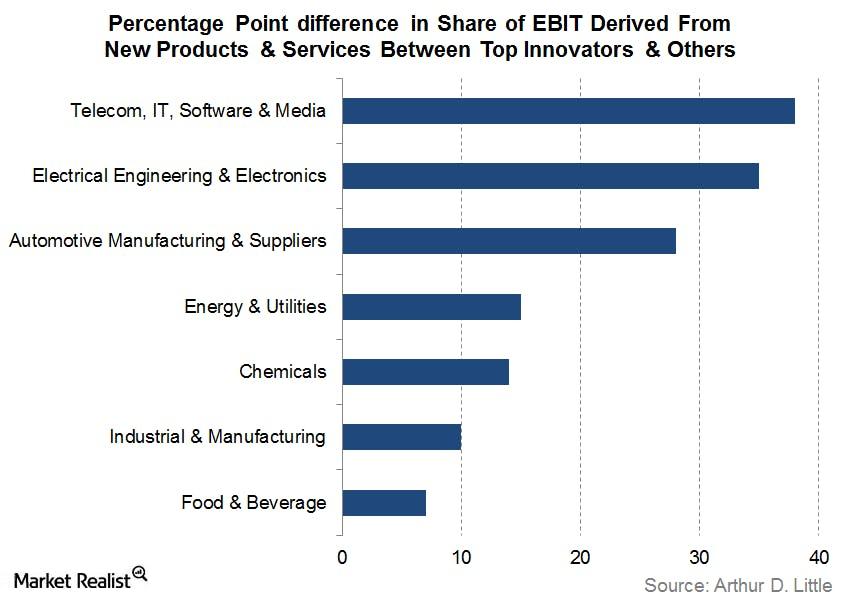
According to research from Arthur D. Little, there’s an average 13 percentage point difference between the share of EBIT derived from new products and services by the top innovators and the share derived by others. The difference is especially stark in tech (IYW)(VGT) and telecom, where it stands at 38 percentage points. You can see this difference in the above graph.
Technological innovation (XT) helps reduce costs to a business and increase its productivity and profitability. Though the impact of technology on employment and job loss gets a lot of attention, consumption metrics ignore the impact of technology on reducing prices. Consumption statistics also fail to observe how technological advancement is making the economy more efficient. In the next part of this series, we’ll discuss how rapidly advancing technology adoption rates and a sharing economy are making for a more efficient economic system.
