How Hologic’s Valuation Stacks Up with Peers
The company has delivered a robust financial performance in recent quarters. However, the stock has been on a bearish trend during the recent period.
Nov. 20 2020, Updated 5:23 p.m. ET

Hologic’s valuation
Hologic is a medical technology firm focused on developing solutions for women’s health. The company has delivered a robust financial performance in recent quarters. However, the stock has been on a bearish trend during the recent period. Year-to-date, Hologic stock is down ~9.6%.
The company has recently recalled some of its vaginal rejuvenation products and suspended their marketing and distribution. The event led to a ~4% decline in its stock price on August 13, when the announcement was made. However, on August 1, the company reported strong Q3 2018 results and raised its fiscal sales as well as earnings guidance.
Forward PE multiples
The forward PE multiple is one of the key valuation metrics used across industries. It represents how much an investor is willing to pay for a unit of the companies’ expected earnings over the next one year. The forward PE ratio of a stock is measured by dividing its current stock price by the company’s next-12-month earnings estimate. Usually, an overvalued stock or a high growth company has a high forward PE, while a stock with a lower forward PE compared to peers and the industry might be undervalued.
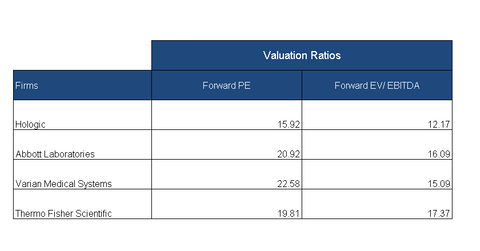
As of September 7, Hologic (HOLX) was trading at a forward PE (price-to-earnings) ratio of 16x compared to the industry average forward PE of 21.8x. Hologic’s peers Varian Medical Systems (VAR), Abbott Laboratories (ABT), and Thermo Fisher Scientific (TMO) had PE multiples of 22.6x, 20.9x, and 19.8x, respectively.
Forward EV-to-EBITDA multiples
Hologic’s forward EV-to-EBITDA (enterprise value to earnings before interest, tax, depreciation, and amortization), which is a capital-structure-neutral valuation measure, is 12.2x. This multiple is lower than the industry average of 16.7x as well as that of peers Varian Medical Systems, Abbott Laboratories, and Thermo Fisher Scientific, which have forward EV-to-EBITDA multiples of 15.1x, 16.1x, and 17.4x, respectively.
Be sure to check out all the data we’ve added to our quote pages. Now you can get a valuation snapshot, earnings and revenue estimates, and historical data, as well as dividend information. Take a look!
