Where Netflix’s Valuation Stands among Its Peers
Netflix is now trading at a PE (price-to-earnings) multiple of 239.61x.
July 26 2018, Updated 9:00 a.m. ET

Market capitalization
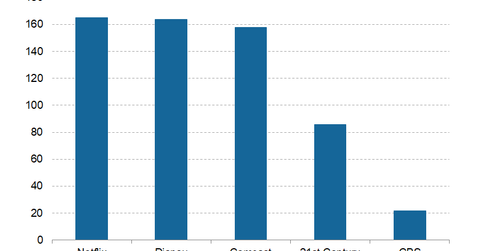
Netflix (NFLX) has earned 134.68% in the trailing one-year period but declined 3.19% and 8.0% in the trailing one-month and five-day periods, respectively. The company had a market cap of $164.9 billion on July 17.
Among Netflix’s media peers, the market caps of Walt Disney (DIS), 21st Century Fox (FOXA), Comcast (CMCSA), and CBS (CBS) stand at $163.9 billion, $85.9 billion, $157.7 billion, and $21.9 billion, respectively.
Valuation metrics for Netflix
Valuation metrics consist of price-based multiples and earnings-based multiples. On July 17, 2018, Netflix had a trailing EV-to-EBITDA[1. enterprise value to earnings before interest, tax, depreciation, and amortization] multiple of 22.83x, which was higher than the multiples of its most prominent peers.
Disney and Comcast had EV-to-EBITDA multiples of 10.93x and 7.93x, respectively. Despite a hefty valuation, Netflix has generated substantial returns for investors in the past. The company’s stock is expected to continue that trend on the back of investments in original content.
Netflix expects its EV-to-EBITDA multiple in 2018 to be 86.08x, and this multiple is expected to be 58.32x in 2018.
Netflix is now trading at a PE (price-to-earnings) multiple of 239.61x. In 2018, its PE multiple is expected to reach 139.83x, and its PE multiple is expected to be 87.0x in 2019.
