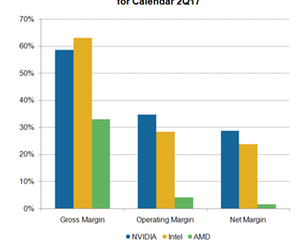
Where NVIDIA’s Margins Stand next to Those of Intel and AMD
NVIDIA’s profit margins NVIDIA (NVDA) has been increasing its revenue while controlling its expenses, resulting in improved profitability and a high free cash flow of up to 20% of its total revenues. Gross margin NVIDIA’s non-GAAP (generally accepted accounting principles) gross margin fell 90 basis points from 59.7% in fiscal 1Q18 to 58.6% in fiscal 2Q18 […]
Dec. 4 2020, Updated 10:53 a.m. ET

NVIDIA’s profit margins 
NVIDIA (NVDA) has been increasing its revenue while controlling its expenses, resulting in improved profitability and a high free cash flow of up to 20% of its total revenues.
Gross margin
NVIDIA’s non-GAAP (generally accepted accounting principles) gross margin fell 90 basis points from 59.7% in fiscal 1Q18 to 58.6% in fiscal 2Q18 because the company stopped receiving licensing revenues from Intel (INTC). NVIDIA’s gross margin is lower than Intel’s gross margin of 63% but higher than Advanced Micro Devices’ (AMD) margin of 33%.
For fiscal 3Q18, NVIDIA expects its gross margin to remain stable at 58.6% as it transitions to TSMC’s (TSM) 12 nm (nanometer) node with its Volta GPU (graphics processing unit). The company will likely realize the cost benefit from the 12 nm node from fiscal 4Q18 onward.
Operating margin
While NVIDIA’s gross margin is lower than that of Intel, its non-GAAP operating margin is higher than that of Intel because its revenues are growing faster than its expenses. On a YoY (year-over-year) basis, NVIDIA’s operating income doubled to $773 million, reaching an operating margin of 34.6%—way above Intel’s and AMD’s margins of 28.4% and 4%, respectively.
NVIDIA’s non-GAAP operating expenses rose 19% YoY to $533 million as it hired engineers for its growth initiatives. NVIDIA spends 24% of its revenues on operating expenses, while AMD and Intel spend 31% and 34.5%, respectively, of their revenues on operating expenses.
Operational efficiency next to peers
This shows that NVIDIA’s operational efficiency is higher than that of its peers, and its platform strategy is helping it reduce R&D (research and development) costs and maximize returns. Under its platform strategy, the company develops differentiated GPUs for various applications—GeForce for gaming and Quadro for professional visualization—by leveraging single architectures such as Pascal and Volta.
For fiscal 3Q18, NVIDIA expects its operating expenses to rise 19% YoY, or 7% sequentially, to $570 million as the company moves to new headquarters and increases the annual compensation of its employees. Its operating margin is expected to remain ~34% as expenses are expected to rise faster than revenues.
