How Is Flotek Industries Currently Valued Compared to Its Peers?
RPC is the largest company by market capitalization among our set of select OFS companies. Flotek Industries is the smallest of the lot.
Aug. 17 2016, Updated 11:04 a.m. ET

Comparable company analysis
EV-to-EBITDA
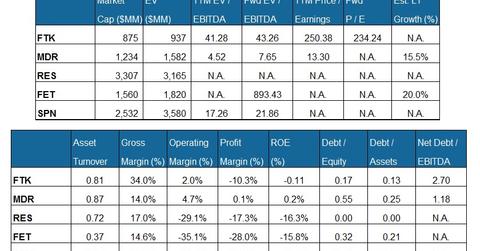
Flotek Industries’ (FTK) EV (enterprise value), when scaled by trailing-12-month adjusted EBITDA (earnings before interest, tax, depreciation, and amortization) is higher than the peer average. McDermott International (MDR) has the lowest trailing-12-month EV-to-EBITDA multiple among its peers.
Forward EV-to-EBITDA is a useful metric for gauging relative valuation. FTK’s forward EV-to-EBITDA multiple expansion compared to its trailing-12-month EV-to-EBITDA is lower than the peer average. This is because the expected fall in FTK’s adjusted operating earnings in 2016 has been less extreme than the peer average. This is typically reflected in a higher current EV-to-EBITDA multiple.
Debt levels
FTK’s net debt-to-equity multiple is lower than the peer average. A lower multiple could indicate decreased credit risk. This is comforting, particularly when crude oil prices are volatile. FTK makes up 0.13% of the SPDR S&P 600 Small Cap ETF (SLY).
Price-to-earnings ratio
Flotek Industries’ current valuation, expressed as a trailing-12-month PE (price-to-earnings) multiple of 250x, is higher than the peer average. Its forward PE multiple contraction reflects the potential for mild adjusted earnings growth in the next four quarters.
Next, we’ll discuss whether investors have shown interest in FTK’s stock as indicated by its short interest.
